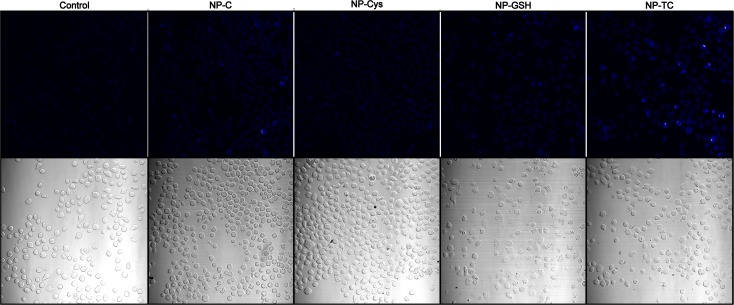
Fig. 7.
Fluorescence microscopy images of cells that were incubated with different NPs (Au-C, Au-Cys, Au-GSH, or Au-TC) or cultured in the absence of NPs as a control. The corresponding transmitted light microscopy images are shown in the lower panel. Images from three different experiments were analyzed and both total and positive cells were counted with the aid of FIJI® software. The percentage of fluorescent cells from three different experiments was analyzed for statistical significance by ANOVA (only NP-TC shows a statistically significant increase in fluorescence above control cells [p < 0.01])

