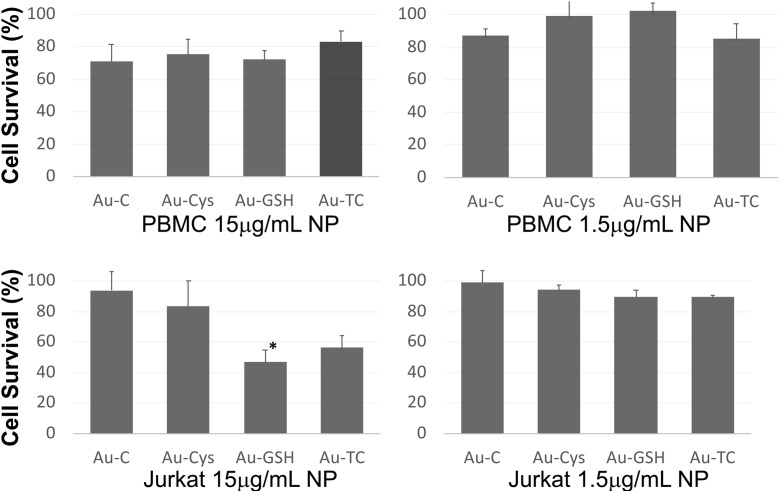
Fig. 8.
MTT cell viability assay of primary lymphocytes (upper panels) or Jurkat tumor cells (lower panels), incubated with the indicated NPs at 15 μg/mL (left panels) or 1.5 μg/mL (right panels). Results are represented as the mean ± standard deviation of at least three independent experiments performed in triplicate. Statistical analysis was performed using the GraphPad Prism 5.00 software. Significance was determined using a t test. Statistical significance is indicated by an asterisk (*p < 0.05)

