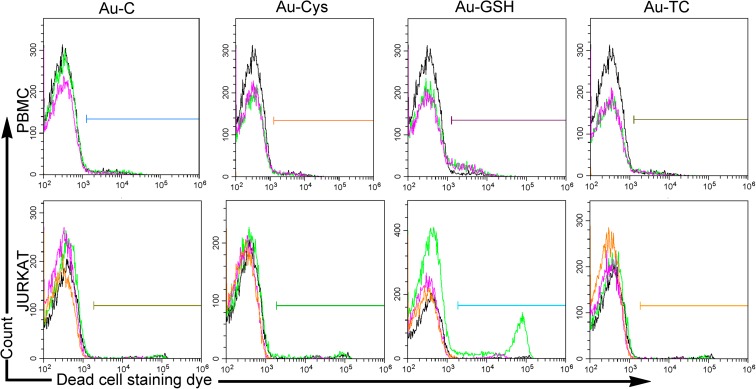
Fig. 9.
Flow cytometry dot plot showing the cytotoxicity profile of primary lymphocytes—PBMC—(upper panels) or Jurkat tumor cells (lower panels), cultured with the indicated NPs. Cells (at least 10,000) were electronically gated according to their size/granularity distribution. Histograms corresponding to three Live/dead™ cell staining (dead cells) experiments are shown for each Np. Within each histogram, different experiments for each NP are shown in different colors, with the control sample with no NP shown in black. According to a one-way ANOVA analysis (XLSTAT® Excell®), only PBMC cultured in the presence of Au-GSH showed a significant increase in cell dead when compared to cells cultured in the absence of NPs (p < 0.002)

