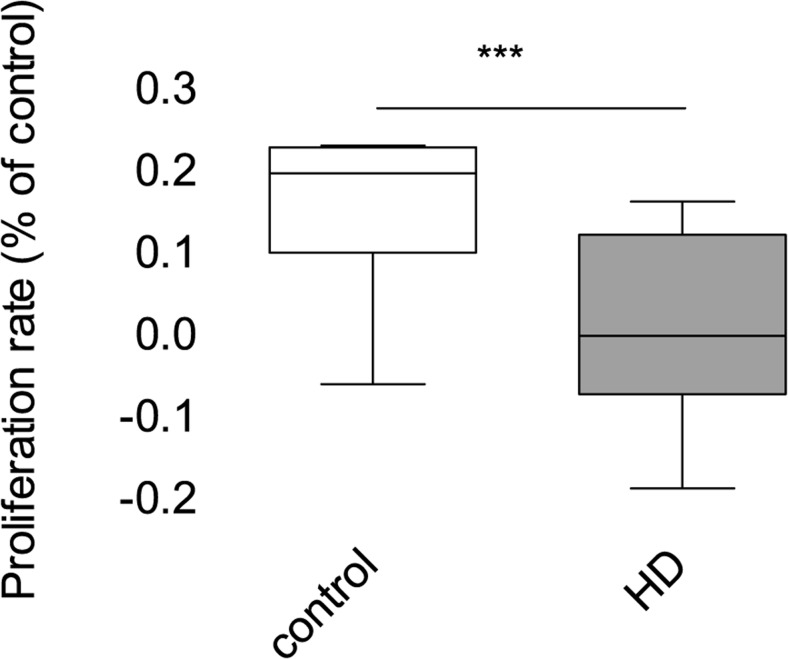
Fig. 1.
Proliferation of control and HD fibroblasts. The SRB procedure was performed at 2nd and 4th day after seeding. For each cell line, the slope of the proliferation curve was calculated. Box plot represents median, 25 and 75% percentiles, and minimum and maximum. Statistically significant p-values were considered when: *p < 0.05, **p < 0.01, ***p < 0.001. The exact p-value is p = 0.0176 for HD patients vs. control

