Fig. 4.
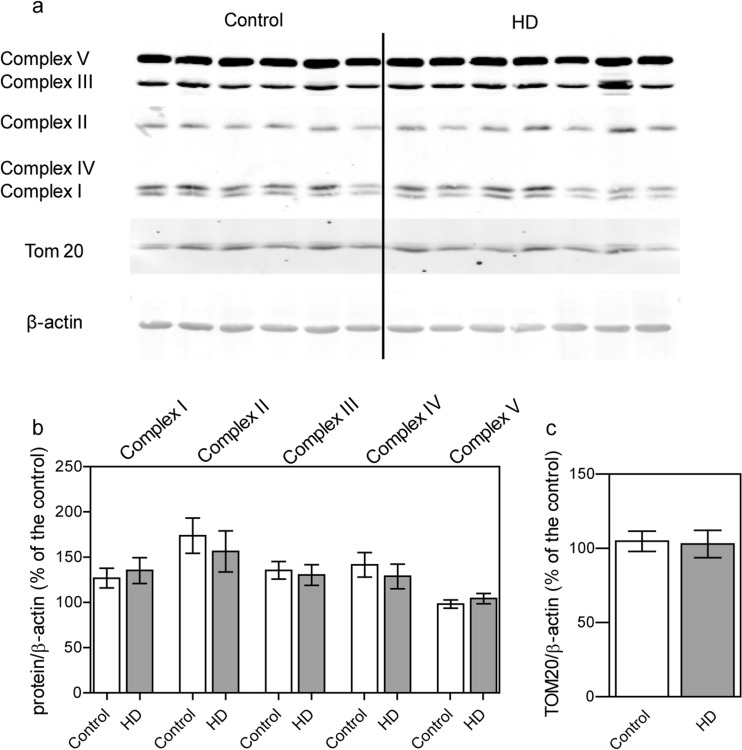
Level of representative subunits of the mitochondrial respiratory chain complexes and TOM20 in control and HD patient’s fibroblasts. Statistically significant p-values were considered when: *p < 0.05, **p < 0.01, ***p < 0.001. a Representative Western blots of OXPHOS subunits (CV-ATP5A, CIV-MTCO1, CIII-UQCRC2, CII-SDHB, CI- NDUFB). Samples (40 μg protein/lane) were separated on 10% gel. b Densitometry analysis of OXPHOS subunits. The level of individual protein was calculated as a ratio to β-actin. Data shown are means ± SD. The exact p-values for each comparison are listed below. Complex I, p = 0.6526 for HD patients vs. control; Complex II, p = 0.3424 for HD patients vs. control; Complex III, p = 0.7354 for HD patients vs. control; Complex IV, p = 0.5103 for HD patients vs. control; Complex V, p = 0.4289 for HD patients vs. control. c Densitometry analysis of mitochondrial mass marker TOM20 The level of Tom 20 was calculated as a ratio to β-actin. Data shown are means ± SD The exact p-value is p = 0.8754 for HD patients vs. control

