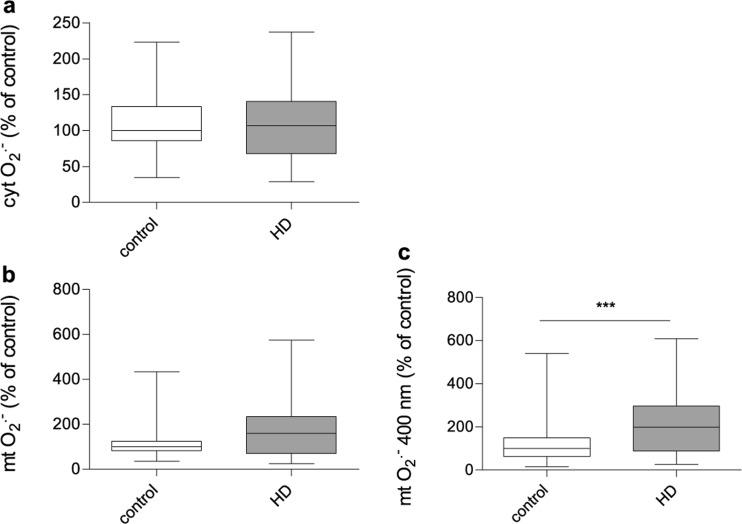
Fig. 5.
The level of reactive oxygen species in control and HD patient’s fibroblasts. 100% represents the median of analyzed parameters of the control fibroblasts’. Box plot represents median, 25 and 75% percentiles, and minimum and maximum. Statistically significant p-values were considered when: *p < 0.05, **p < 0.01, ***p < 0.001. The exact p-values for each comparison are listed below. a cytosolic reactive oxygen species level (cyt. ROS) (p = 0.92 for HD patients vs. control), b mitochondrial superoxide level (mt. O2•-) (p = 0.06 for HD patients vs. control), c mitochondrial superoxide level (mt. O2•-) measured by a specific excitation peak at ~400 nm (p = 0.0006 HD patients vs. control)

