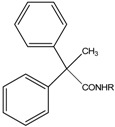
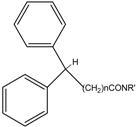
Table 1.
Biological activities of samples 1-11.
| Cmp. | R | (a) % inhibition ABTS + | (b) T.E A.C (µM) | (c) LD50 (ppm) [95% confidence intervals] |
|---|---|---|---|---|
 | ||||
| 1 | 4-methoxyphenyl | 3.4 | 0.8 | 4.94 [11.04/1.73] |
| 2 | 3,4-dimethoxybenzyl | 3.06 | 0.7 | 9.45 [16.25/5.43] |
| 3 | 4-morphinylphenyl | 78.19 | 20.3 | 9.66 [17.51/5.27] |
| 4 | 4-methoxybenzyl | 41.8 | 10.8 | 5.9941 [10.7/3.16] |
| 5 | 4-methoxyphenethyl- | 0.67 | 0.17 | 3.4918 [5.77/2.05] |
 | ||||
| 6(d) | 4-methoxyphenyl | n.a. | n.a. | 14.34 [54.34/4.8] |
| 7 | 3,4-dimethoxybenzyl | 7.63 | 1.98 | 11.97 [28.93/5.22] |
| 8 | 4-morpholinyphenyl | 71.4 | 18.6 | n.a. |
| 9 | 3,5-dimethoxybenzyl | 33.93 | 8.8 | 25.13 [123.08/9.36] |
| 10 | 4-fluoro- N,N-diethylbenzylamine | 4.17 | 1.08 | 1.38 [2.19/0.75] |
| 11 | 4-methoxyphenethyl- | n.a. | n.a. | 14.45 [66.38/4.35] |
(a) Percentage of the absorbance of the uninhibited radical cation solution obtained by using ABTS method. (b) Antioxidant activity of samples expressed as T.E.A.C (µM). (c) Biological activity in brine shrimps assay of samples. In square parenthesis are shown the values of 95% confidence intervals; n.a. no activity, (d) n:1. R = amines listed in table; n = 0, 1, 2
