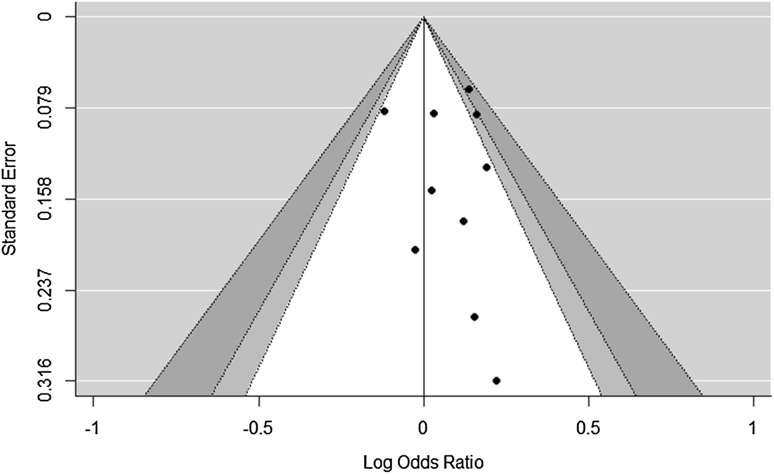
Fig. 4.
Funnel plot of the logarithmically transformed odds ratios and standard errors from pooled groups with AAM categories of less than 13 years and more than 13 years (with the categories containing an age at menarche of 13 years used as the reference). White is the 90% boundary, light grey is the 90–95% boundary and dark grey is the 95–99% boundary

