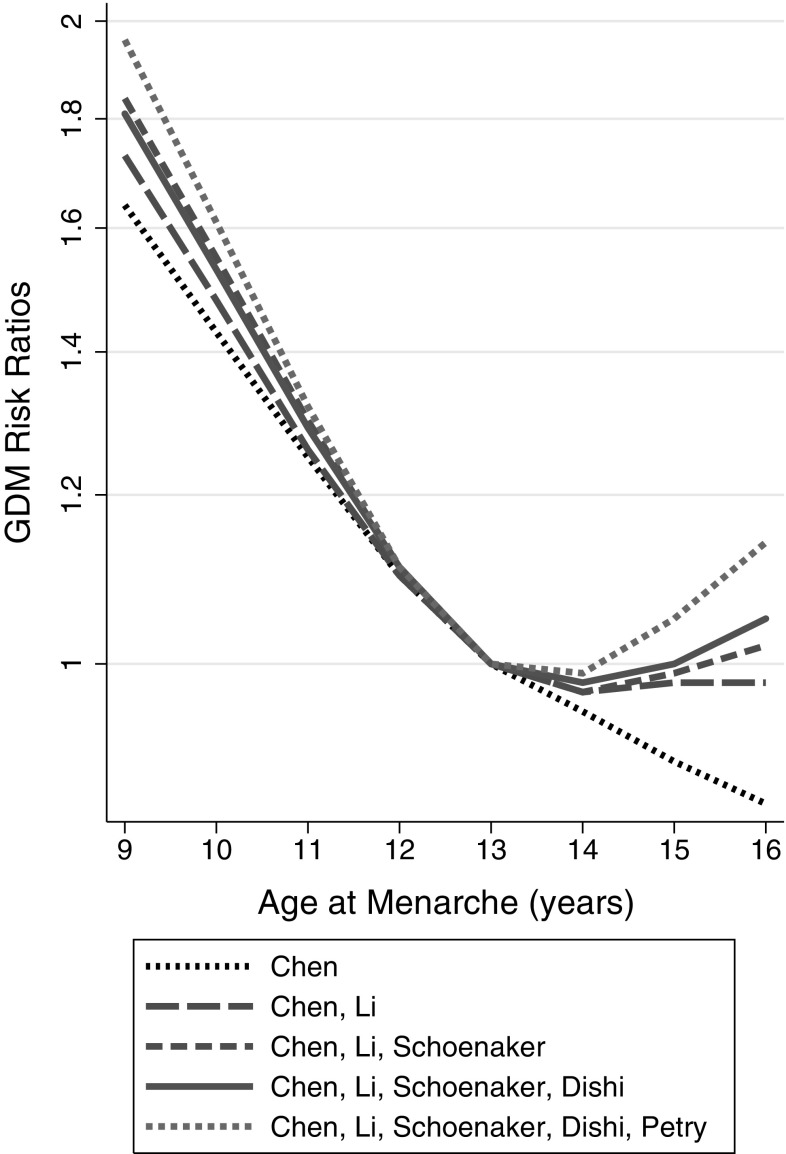
Fig. 5.
Pooled dose response associations between AAM and the risk of developing GDM in pregnancy relative to the risk associated with an AAM of 13 years. The different lines represent values from just using the largest study, then the two largest studies, then three, etc. until all the five studies were included in the analysis. The lines are labelled in the legend according to the first author of the manuscript describing each of the included studies. The associations with AAM were assessed in restricted cubic splines in multivariate random effects dose response models

