Fig. 3.

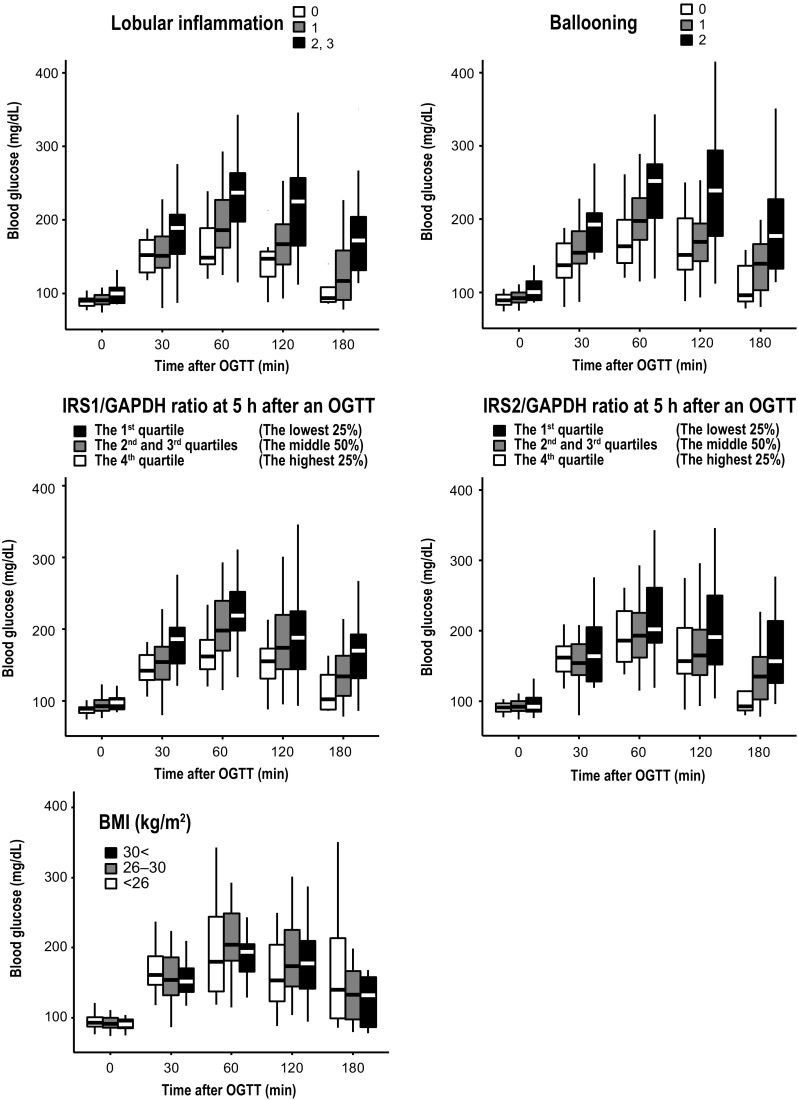
Glucose concentrations during 75-g oral glucose tolerance tests (OGTTs) stratified based on degree of lobular inflammation and ballooning and IRS1 and IRS2 mRNA levels

Glucose concentrations during 75-g oral glucose tolerance tests (OGTTs) stratified based on degree of lobular inflammation and ballooning and IRS1 and IRS2 mRNA levels