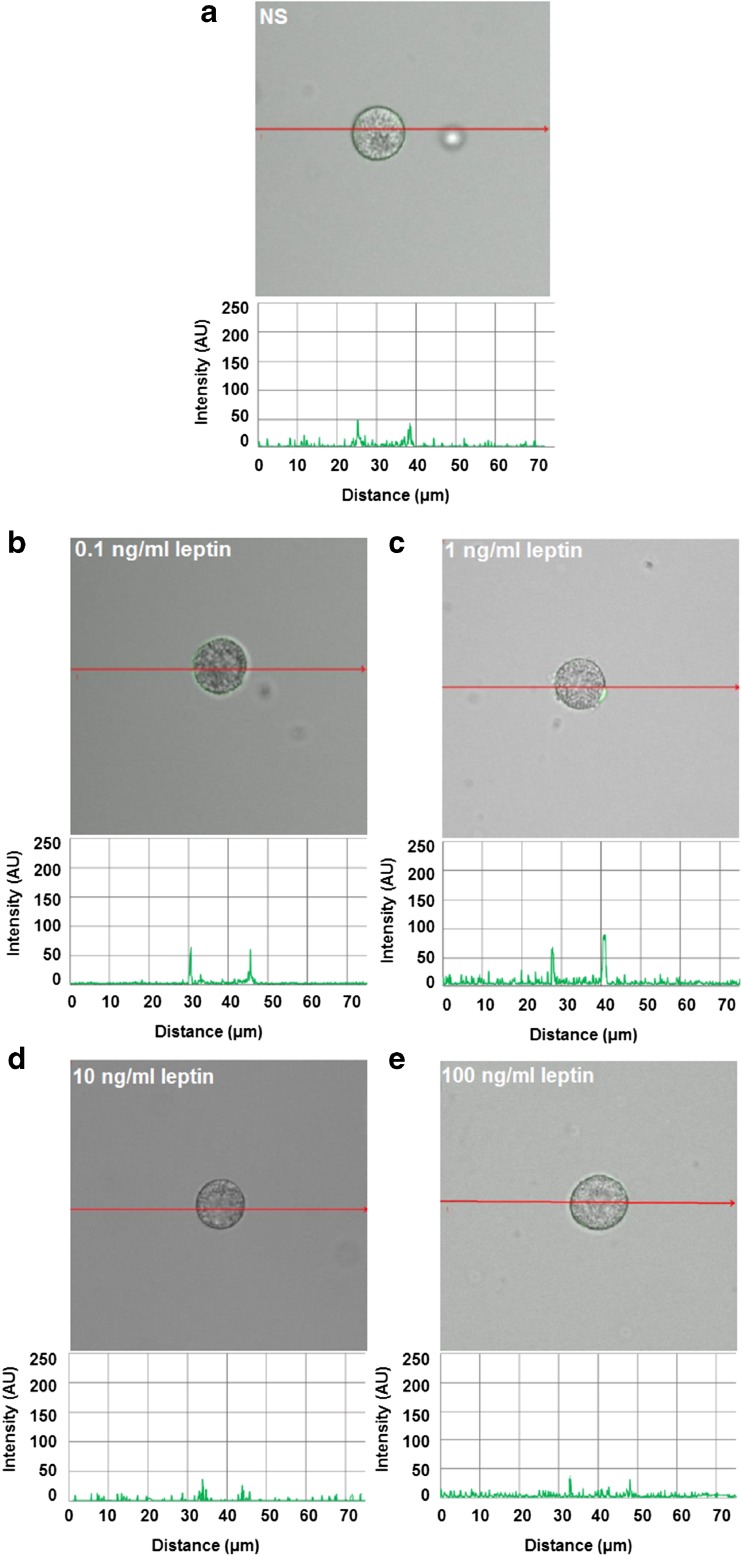
Fig. 4.
Confocal microscopy images of surface Ob-R expression in MCs stimulated by leptin. Cells were incubated with medium alone (unstimulated cells; NS) (a), leptin at concentrations of 0.1 (b), 1 (c), 10 (d), or 100 ng/ml (e). Single confocal sections (midsection of cells) showing the presence of Ob-R and fluorescence intensity diagrams beside microphotographs showing the distribution of fluorescence in cells. Data shown are from one representative experiment out of three performed in duplicate. The signal was visualized with green Alexa Fluor 488

