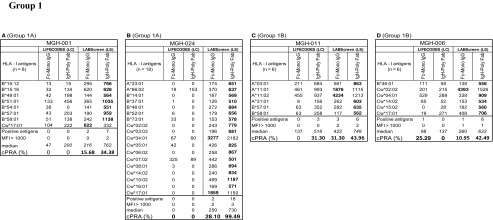
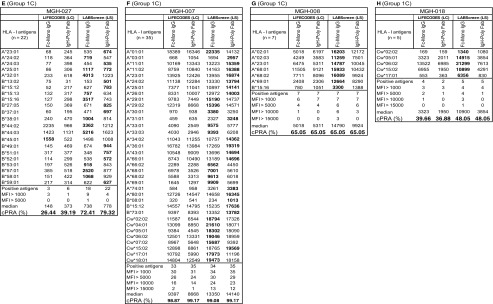
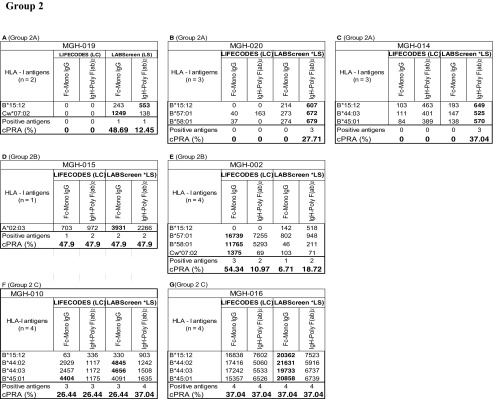
Table 4.
Intraindividual disparity in the MFI of HLA-I reactive antibodies (Group 1 against > 5 HLA antigens, Group 2 against < 5 antigens) in patients’ sera using different secondary antibodies and different beadsets
Based on the MFI values (MFI > 500 = positive), percentage cPRA were determined using the UNOS cPRA calculator (https://optn.transplant.hrsa.gov/resources/allocation-calculators/cpra-calculator). Groups are as described in the “Results” section. Bold MFI values under both beadsets refer to the higher MFI observed among the four categories


