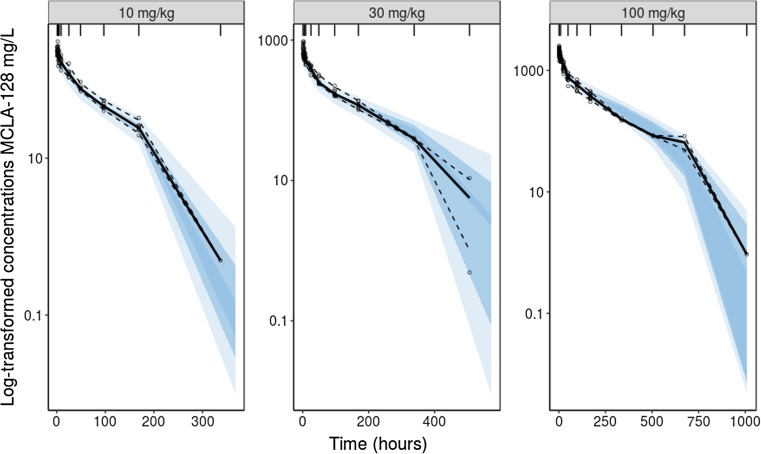
Fig. 1.
Visual Predictive Checks (VPCs) for PK data from cynomolgus monkeys stratified on dose group (10 mg/kg, 30 mg/kg, 100 mg/kg). The solid line represents the median of the observed MCLA-128 concentrations, the dashed lines represents the 5th and the 95th percentiles of the observed data. The shaded areas show the 95% confidence interval of the simulated data for the corresponding percentiles (n = 500).

