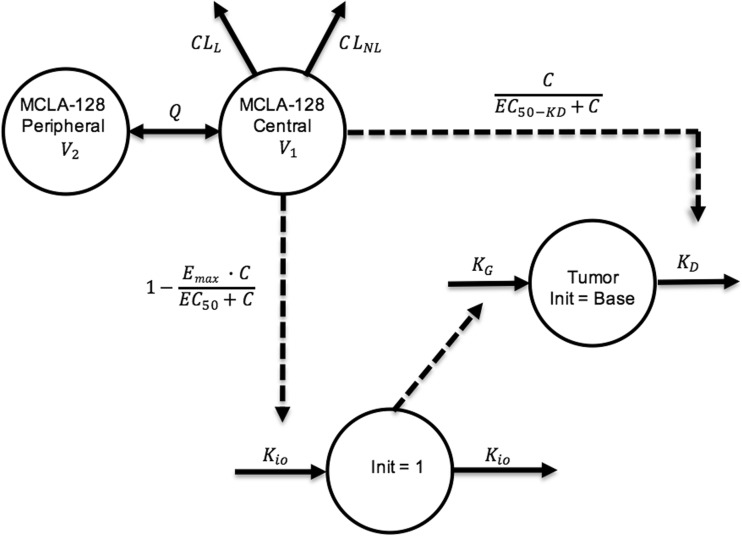
Fig. 2.
Schematic structure of the PK-PD model in mice. CLL = linear clearance, CLNL = nonlinear clearance, V1 = volume of distribution central compartment, V2 = volume of distribution peripheral compartment. KG = zero-order tumor growth rate, KD = tumor dying rate, Kio = production and loss of drug effect on KG, Emax = maximum effect of MCLA-128 on Kio (fixed to 1). EC50 = MCLA-128 concentration with 50% of maximum effect on Kio, EC50_KD = concentration MCLA-128 with 50% of maximum effect on KD. Dotted lines = drug effects

