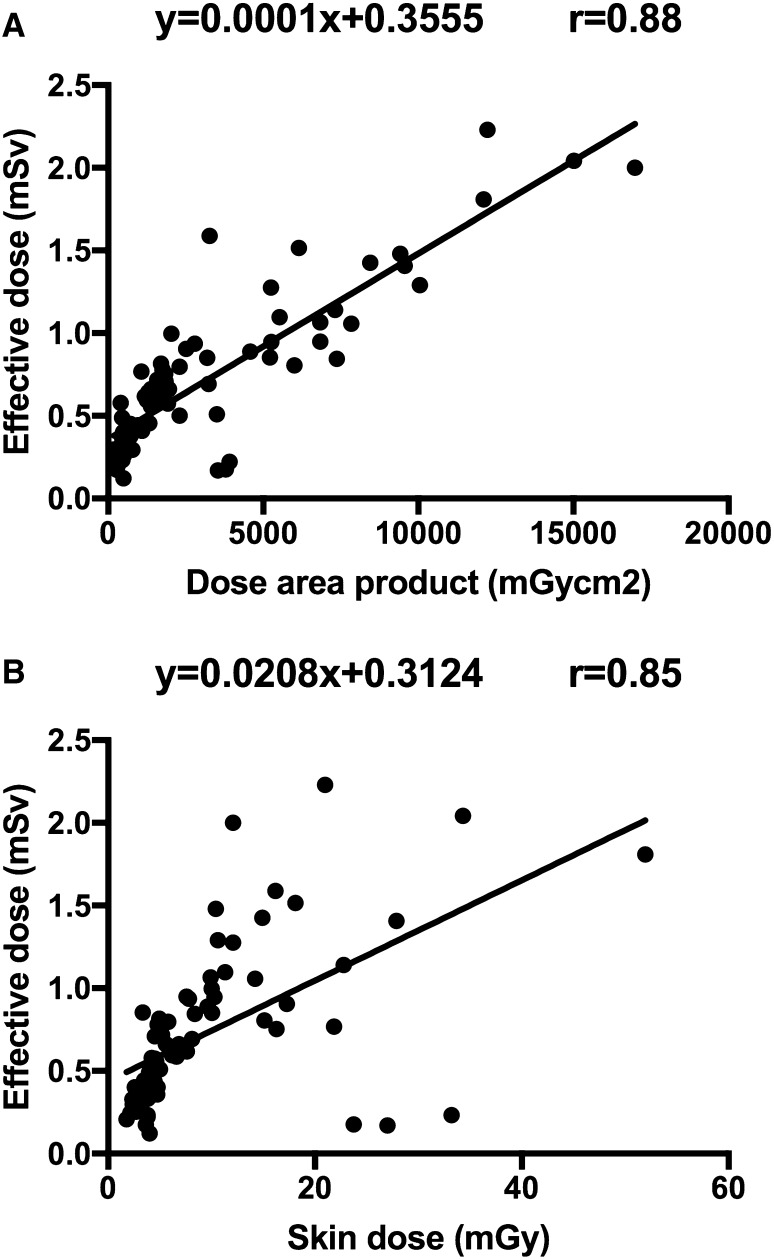
Fig. 2.
a Scatterplot of DAP and ED for patients that underwent a 3DRA in the low-dose cohort—the straight lines indicate the least squared fit for the low-dose cohort. b Scatterplot of skin dose and ED for patients that underwent a 3DRA in the low-dose cohort—the straight lines indicate the least squared fit for the low-dose cohort

