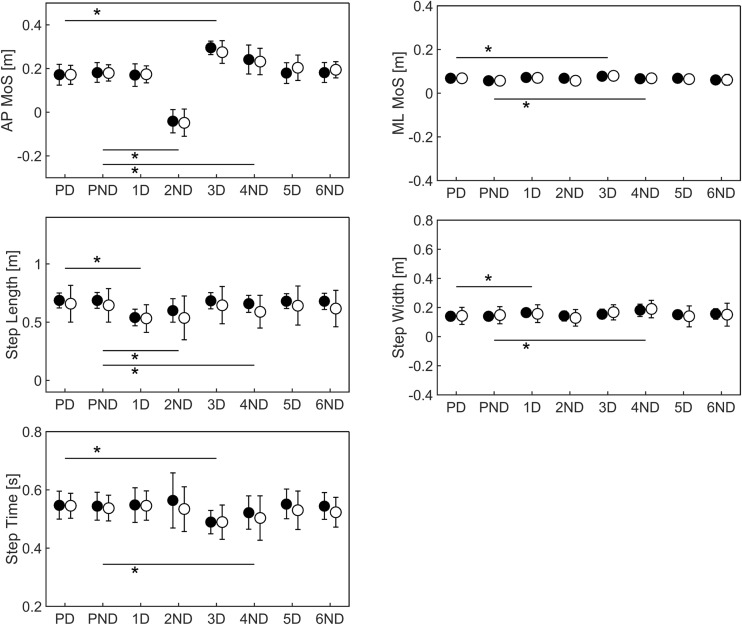
Fig. 7.
Mean and standard deviations of anterior-posterior (AP) and medio-lateral (ML) margins of stability (MoS), step length, width and time for steps for the deceleration (Dec) perturbations. Black dots represent for values young adults whereas white dots represent older adults. Significant differences between pre-perturbation (PD and PND) and post-perturbation (1D to 6ND) steps are indicated with *

