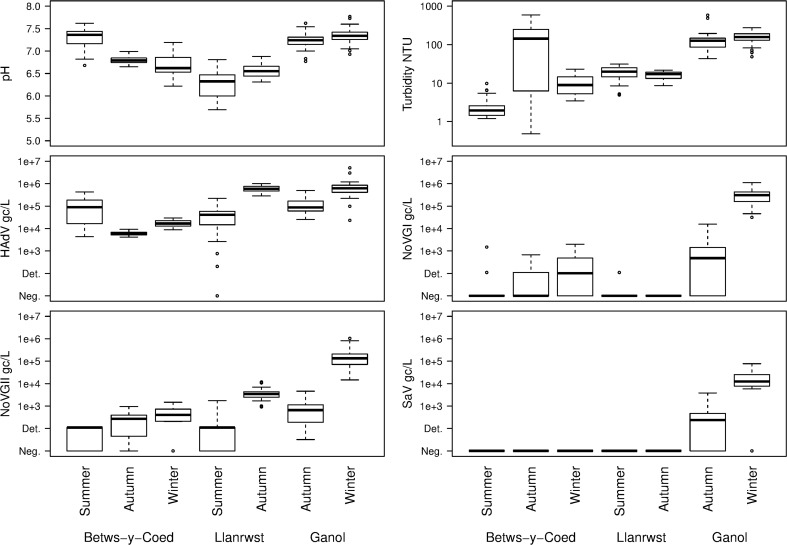
Fig. 2.
Boxplots of measured variables against sampling locations and times. Heavy bars show the median, boxes show the inter-quartile range, whiskers extend to data points no further than 1.5 times the distance between the median and the inter-quartile value. Data points beyond that range are shown individually

