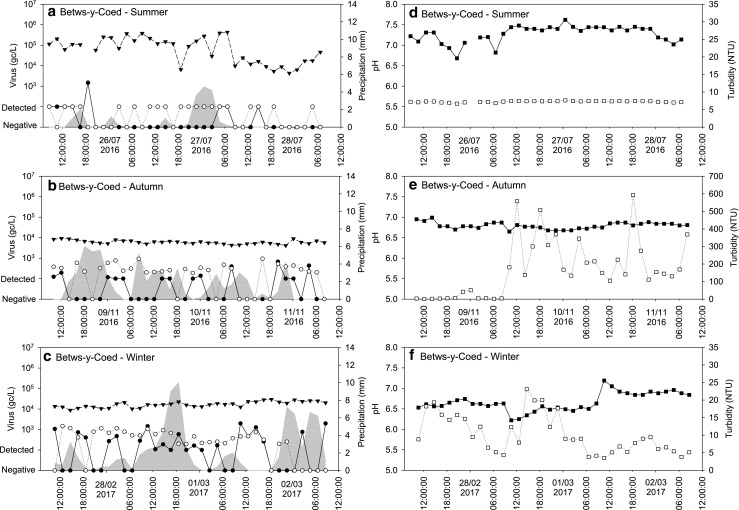
Fig. 3.

Observed NoVGI (○), NoVGII (●) and AdV (▼) concentrations and precipitation (grey area) during the summer sampling (a), autumn sampling (b) and winter sampling (c); pH (closed square) and turbidity (open square) values during the summer sampling (d), autumn sampling (e) and winter sampling (f) in wastewater effluent samples collected at Betws-y-Coed, North Wales. Grey circles, both NoVGI and NoVGII were detected
