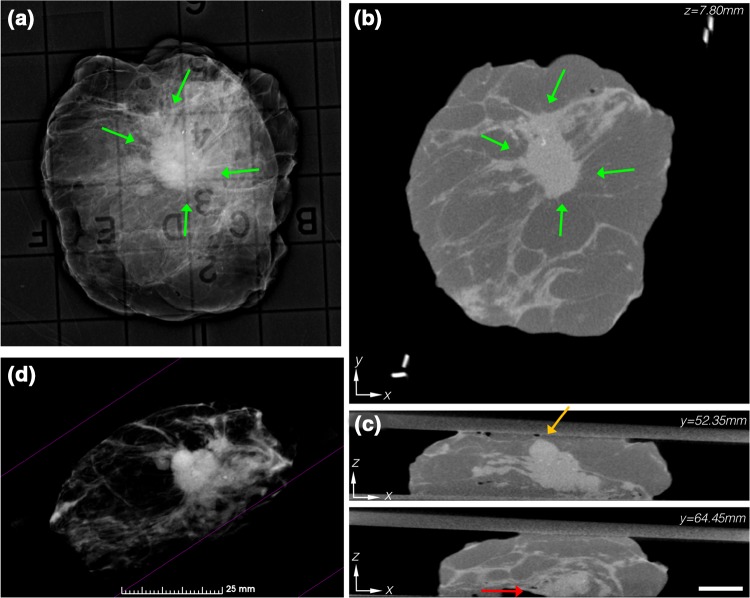
Fig. 1.
a Specimen mammography showing a centrally located IDC + DCIS lesion. b Reconstructed micro-CT slice similarly shows a centrally located lesion. c Orthogonal micro-CT slices 12.1 mm apart reveal a close (≤ 2 mm) anterior margin (orange arrow) and a pathologically positive deep margin (red arrow), which agreed with the final pathologic diagnosis. Micro-CT scale bar is 1 cm. d 3D volume rendering of the specimen, with the adipose tissue thresholded to be transparent, shows the architecture of the lesion and its spiculations (see video in Additional File 2)

