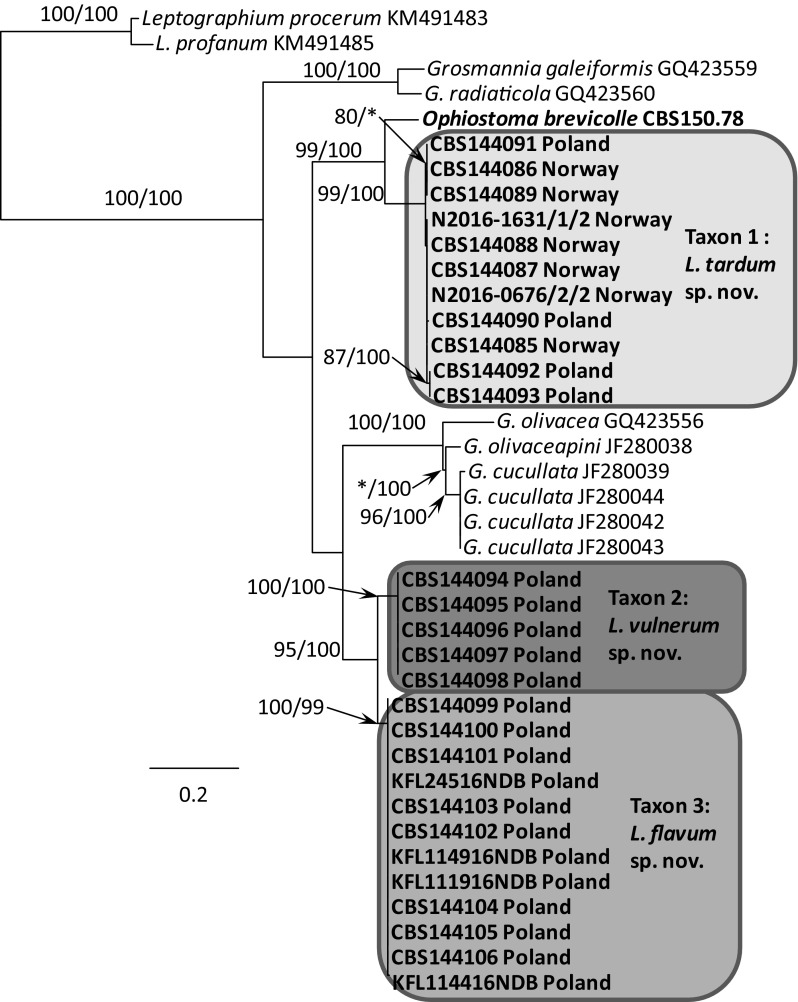
Fig. 6.
Phylogram obtained from the analysis of TEF1-α sequences for members of Leptographium s. l. showing possible placements for the Polish and Norwegian isolates examined in this study. Sequences obtained during this study are presented in bold type. The phylogram was obtained from Maximum Likelihood (ML) analyses. Bootstrap values > 75% for ML and posterior probabilities > 75% obtained from Bayesian (BI) analyses are presented at nodes as follows: ML/BI. *Bootstrap values < 75%. The tree is drawn to scale with branch length measured in the number of substitutions per site

