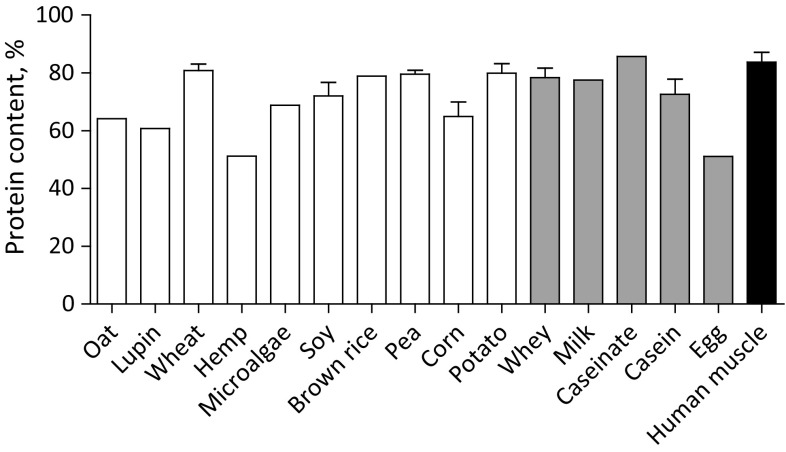
Fig. 1.
Mean (± SEM) protein content (% of raw material) of various dietary protein sources and human skeletal muscle tissue based on the determined nitrogen content multiplied by 6.25 as the standard conversion factor. White bars represent plant-based protein sources, grey bars represent animal-derived protein sources, and black bar represents human skeletal muscle protein

