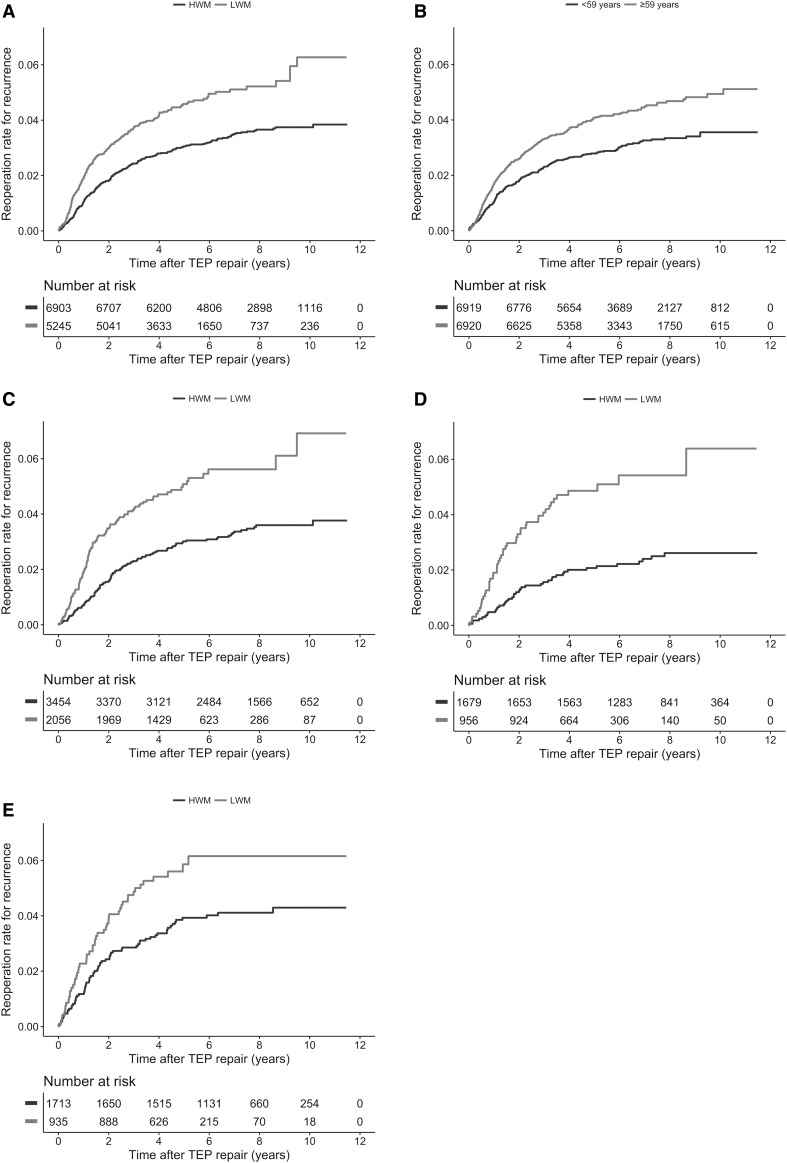
Fig. 2.
Kaplan–Meier hazard plot illustrating time from the TEP repair to reoperation rate for recurrence in a male hernia repairs, b age (divided by median), c direct hernias in male patients, d direct hernias in male patients < 59 years, and e male hernias > 3 cm. a P < 0.001, b P < 0.001, c P < 0.001, d P < 0.001, and e P = 0.020 (log-rank test)

