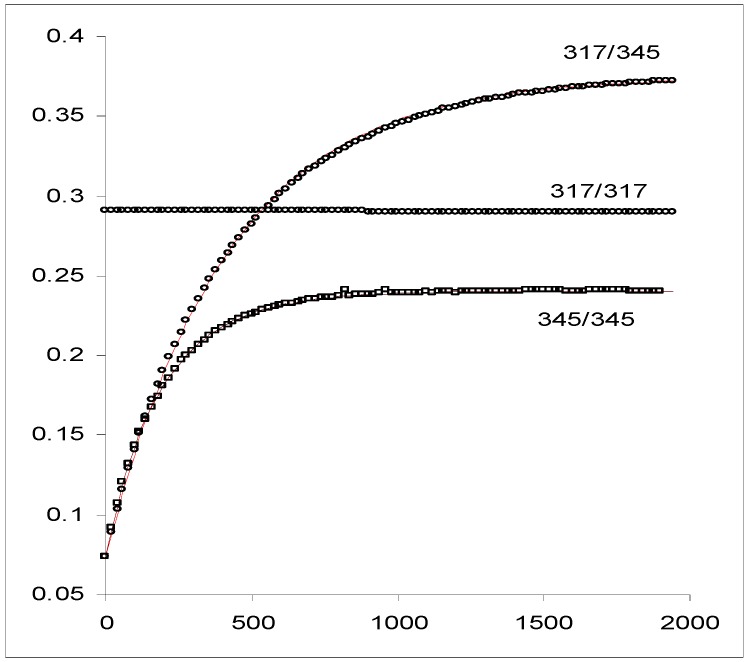
Figure 11.
Experimental traces of DAE (5.6 10-5 M) in hexane at 15 °C. The kinetic traces are labelled by the wavelengths at which the irradiation and the observation were carried out (λexc / λobs). Two of the curves (317/317 and 317/345, in circles) have been performed using the isosbestic irradiation and the third resulted from a non-isosbestic irradiation (345/345, in squares). The line linking the points of trace 317/345 represents the best fit to the monoexponential model, Eq.21a. The line shown on the trace 345/345 has been calculated by a RK integration using the data supplied by the elucidation method (Table 5) [reprinted from Ref. 94 with permission of Photochemical and Photobiological Sciences].

