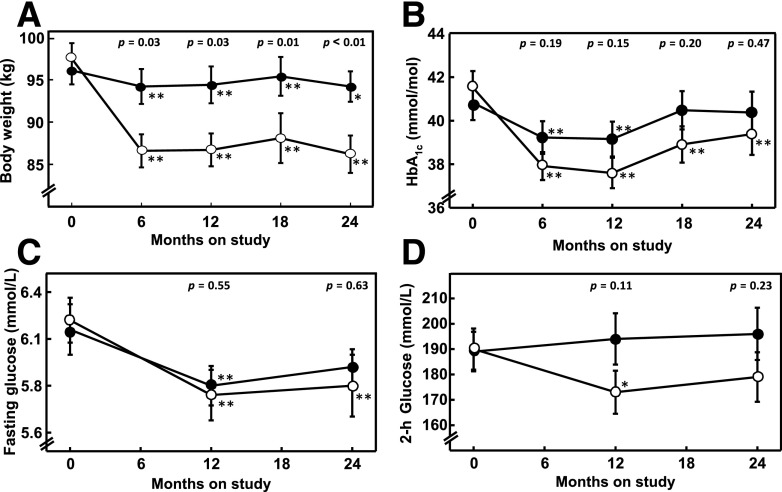
Figure 1.
Body weight (A), HbA1c (B), OGTT fasting (C), and 2-h (D) glucose concentrations over the course of the study in participants who were randomized to gastric banding (open circles, n = 36) or metformin (solid circles, n = 34) and who participated in 24-month glucose clamp studies. Metformin was withheld on the day of each visit. Asterisks denote within-group differences from baseline (*P < 0.05, **P < 0.01). P values listed as text in the top of each figure denote intergroup differences. Data are mean ± SE.

