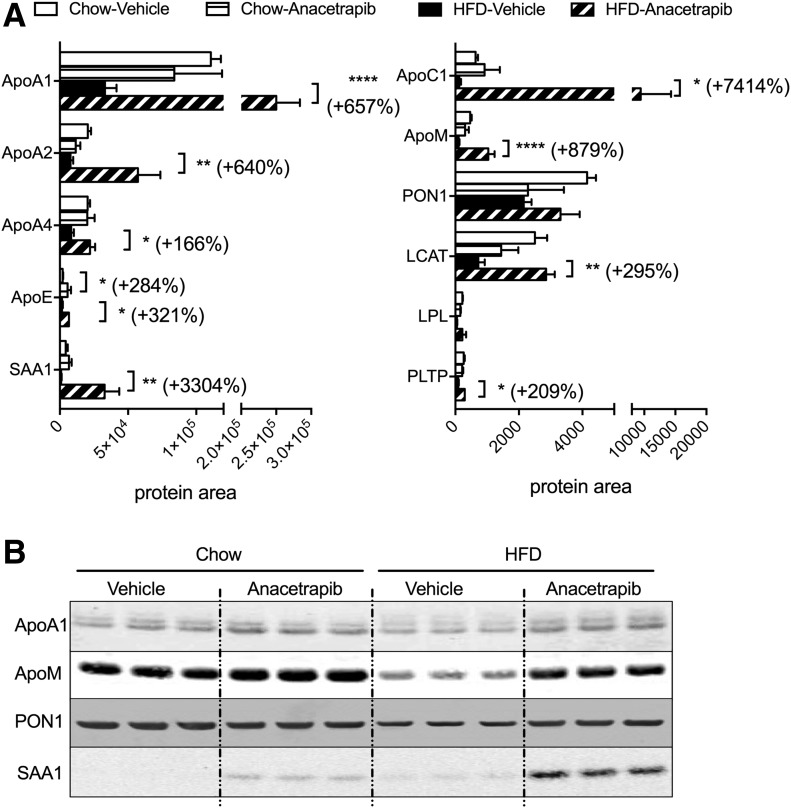
Figure 3.
HDL protein composition and lipoproteins. A: HPLC fractions (30–40) for HDL were subjected to proteomic analysis. The amount of peptides under area for each protein was normalized by total protein amounts of fractions 30–40. B: Immunoblotting was performed with combination of HPLC fraction peaks for HDL cholesterol from each sample. Data are mean ± SD (n ≥ 6). Significant differences were determined using repeated-measures by both factors two-way ANOVA with Bonferroni multiple comparison test. *P < 0.05, **P < 0.01, ****P < 0.0001.

