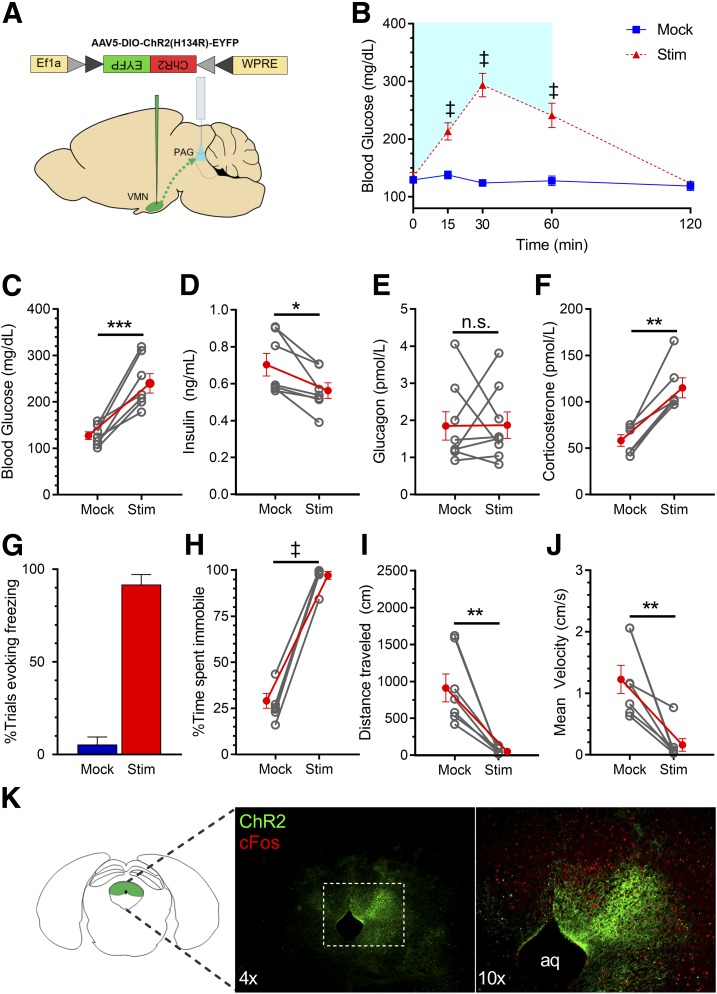
Figure 6.
Photoactivation of VMNNOS1→PAG projections elicits defensive freezing immobility. A: Schematic for laser off (mock) or light-induced stimulation (Stim) of VMNNOS1 terminals in the PAG (VMNNOS1→PAG). B: Blood glucose levels during ipsilateral mock and photoactivation of VMNNOS1→PAG terminals. Blue shading represents the duration of laser-induced stimulation. Blood glucose values at the 60-min time point (C) during which tail blood was collected for measurement of insulin (D), glucagon (E), and corticosterone (F). G: Percentage of photoactivation trials evoking freezing. Percentage of time spent immobile (H), total distance traveled (I), and average velocity (J) during mock and photostimulation (n = 8 for all). K: Representative image indicating terminals of ChR2-expressing VMNNOS1 neurons in the PAG and light-induced c-Fos within the PAG. Values are mean ± SEM. P values by two-way ANOVA (B) and two-tailed, paired Student t test (C–J). *P < 0.05; **P < 0.01; ***P < 0.001; ‡P < 0.0001. aq, cerebral aqueduct.

