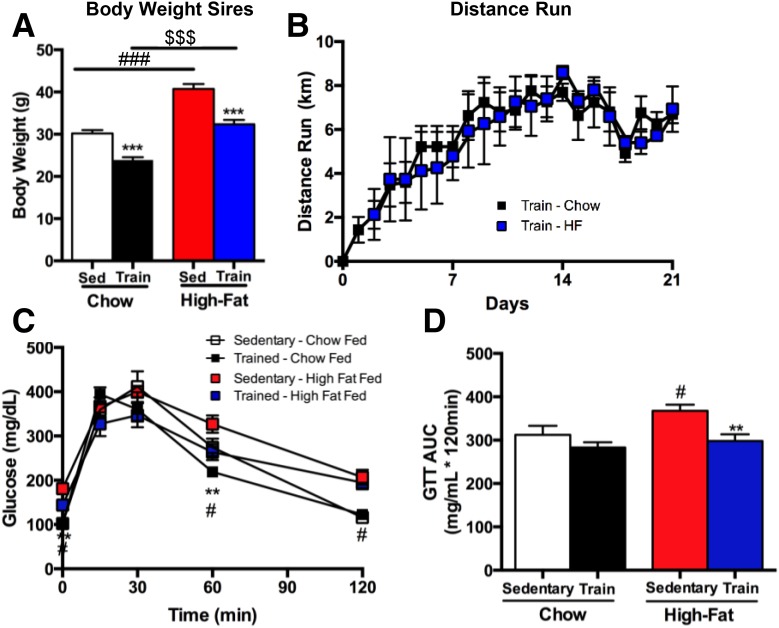
Figure 1.
Exercise reduces body mass and improves glucose tolerance in sires. Body mass (A) and distance run (B) were measured in Sedentary (Sed) and Trained (Train) chow-fed (Chow) and high fat–fed (HF) male mice (sires). Data are expressed as the mean ± SEM (n = 10 group). Symbols represent differences compared with Sedentary diet-matched control groups (***P < 0.001); Sedentary Chow vs. Sedentary High-fat (###P < 0.001); or an overall effect of chow vs. high-fat diet ($$$P < 0.001). C and D: IPGTTs were conducted in Sedentary and Trained chow-fed and high fat–fed male mice and shown as glucose excursion curve (C) and glucose area under the curve (AUC) (D). Data are expressed as the mean ± SEM (n = 4–8/group). Asterisks represent differences compared with Sedentary control groups (**P < 0.01); Sedentary Chow vs. Sedentary High-fat (#P < 0.05). GTT, glucose tolerance test.

