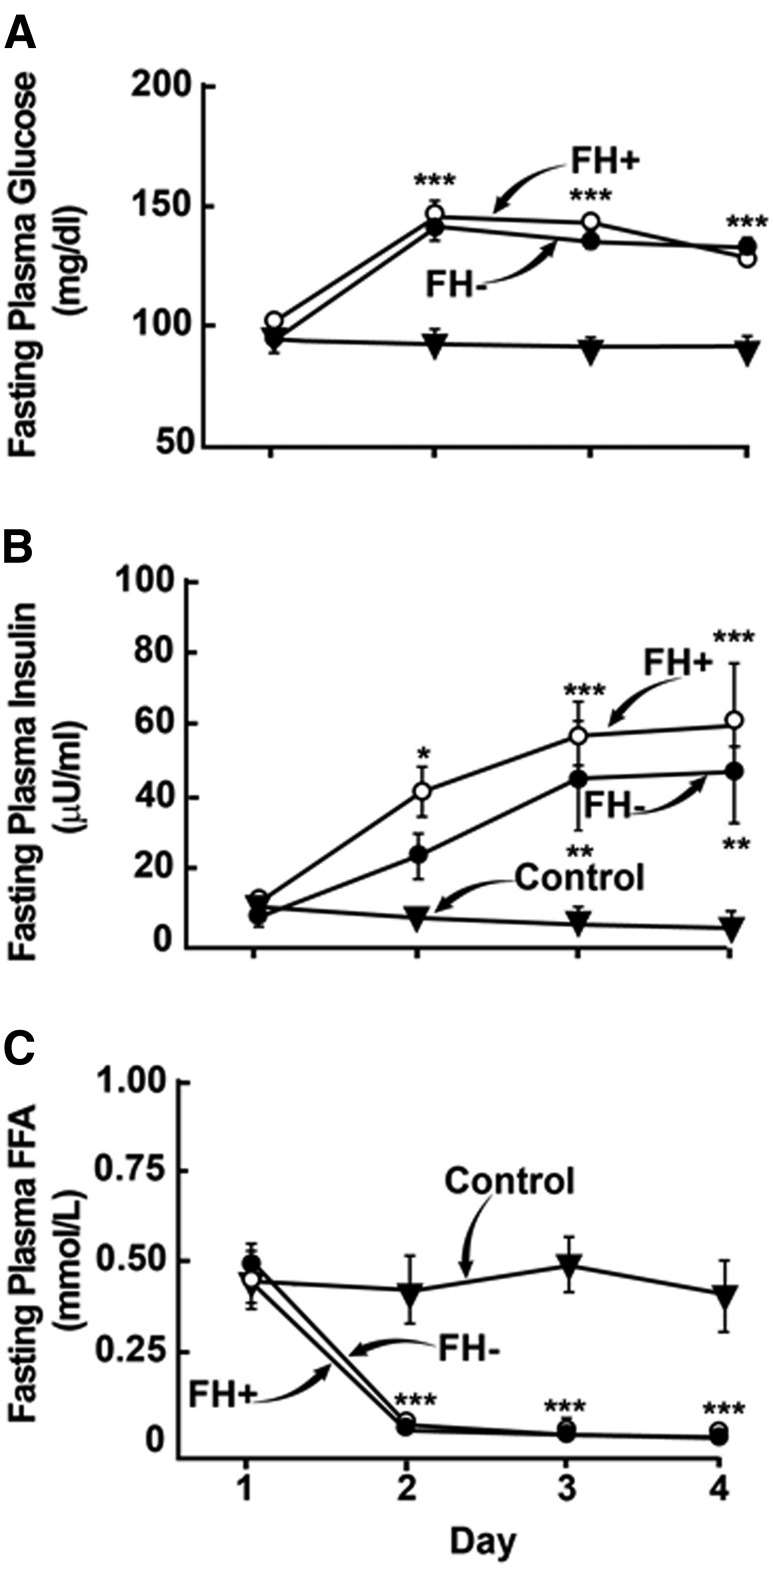
Figure 2.
FPG (A), insulin (B), and FFA (C) concentrations at baseline and during 3 days of either glucose infusion in NGT individuals without (FH−, n = 10) and with (FH+, n = 10) FH of diabetes, or saline infusion in the NGT control group (n = 5). Data represent mean ± SE and were analyzed using two-way mixed-model (group × time) ANOVA. *P < 0.05, **P < 0.01, and ***P < 0.001, vs. control group and vs. baseline.

