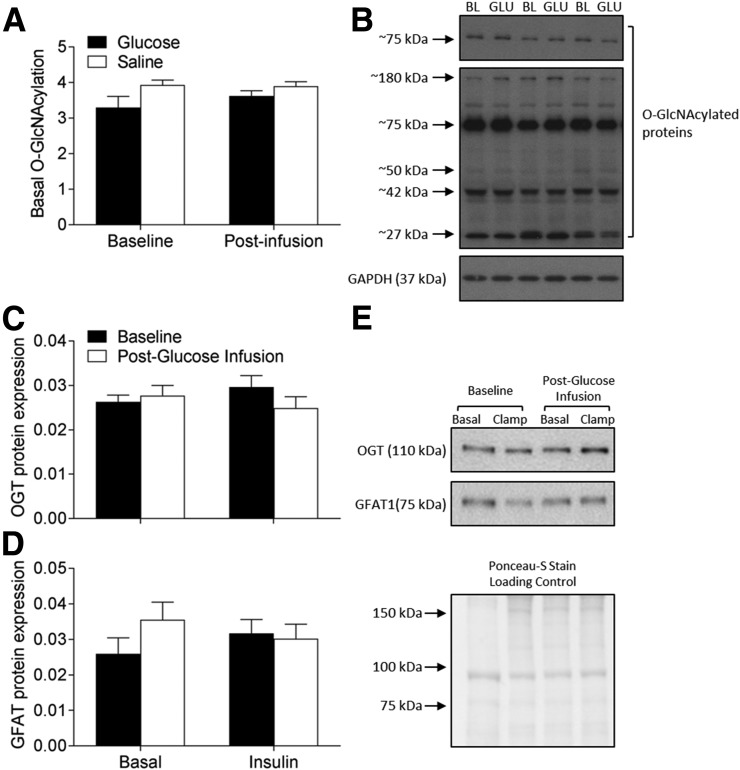
Figure 6.
Basal O-GlcNAcylated protein quantification before and after 3 days of saline (white bars) or glucose (black bars) infusion (A) and representative blot for three subjects receiving glucose infusion (B). Basal and insulin-stimulated OGT (C) and GFAT1 (D) quantification before (black bars) and after (white bars) 3 days of glucose infusion and representative blots (E). Data represent mean ± SE and were analyzed using two-way mixed-model (group × clamp; group × infusion) ANOVA. BL, baseline; GLU, glucose.

