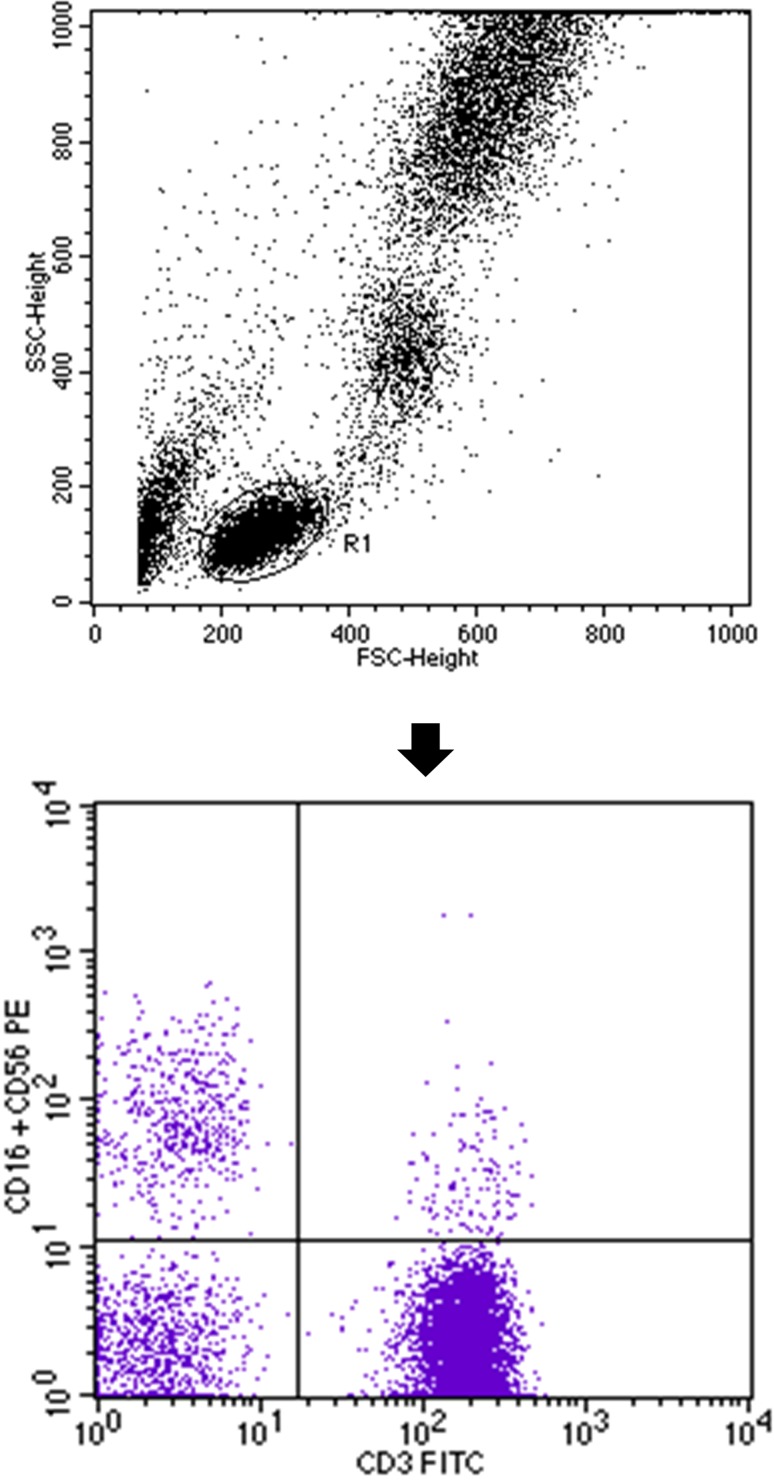
Fig. 3.
Flow cytometric analysis of NK- and NKT-like cells. First, lymphocytes were gated (R1) on the basis of FSC (forward scatter channel) vs. SSC (side scatter channel) signals (upper dot plot). Finally, dot plot CD3+ FITC vs. CD16+CD56+ PE was established. The upper left quadrant of the bottom dot plot represents the percentage of CD3−/CD16+CD56+ (NK) cells and the upper right quadrant of the bottom dot plot represents the percentage of CD3+/CD16+CD56+ T (NKT-like) cells

