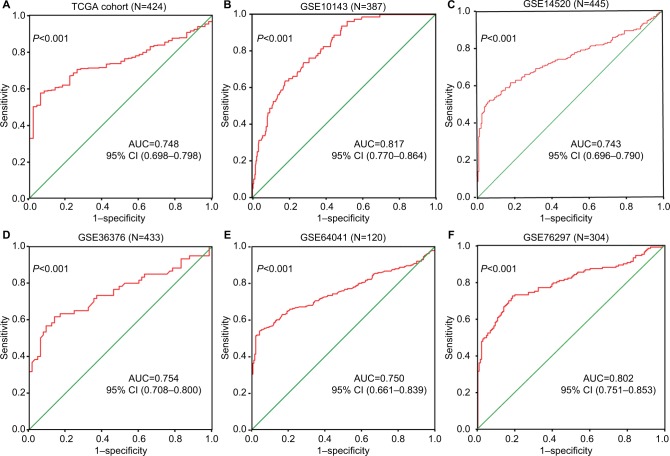
Figure 3.
ROC curves for evaluating the diagnostic power of ENO1 in HCC.
Notes: (A) TCGA cohort. (B) GSE10143. (C) GSE14520. (D) GSE36376. (E) GSE64041. (F) GSE76297.
Abbreviations: AUC, area under the curve; ENO1, enolase-1; HCC, hepatocellular carcinoma; ROC, receiver-operating characteristic; TCGA, The Cancer Genome Atlas.

