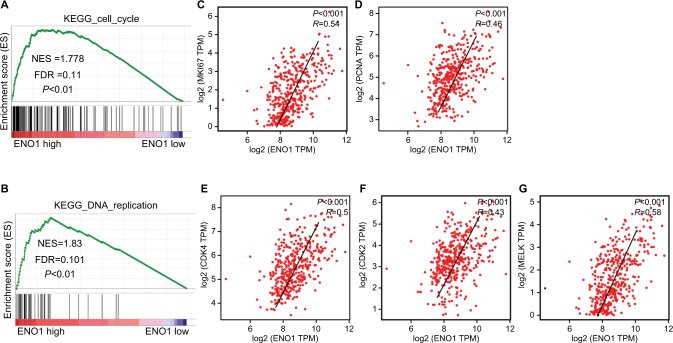
Figure 5.
Molecular mechanism of ENO1 action in HCC.
Notes: GSEA of the relationship between high ENO1 expression and genes associated with cell cycle (KEGG_cell_cycle) (A), and DNA replication (KEGG_DNA_ replication) (B). The scatter plot of the linear association between ENO1 expression level and MKI67 (C), PCNA (D), CDK4 (E), CDK2 (F), and MELK (G).
Abbreviations: ENO1, enolase-1; ES, enrichment score; FDR, false discovery rate; GSEA, gene set enrichment analysis; HCC, hepatocellular carcinoma; NES, normalized enrichment score; TPM, transcripts per millions.

