Figure 1.

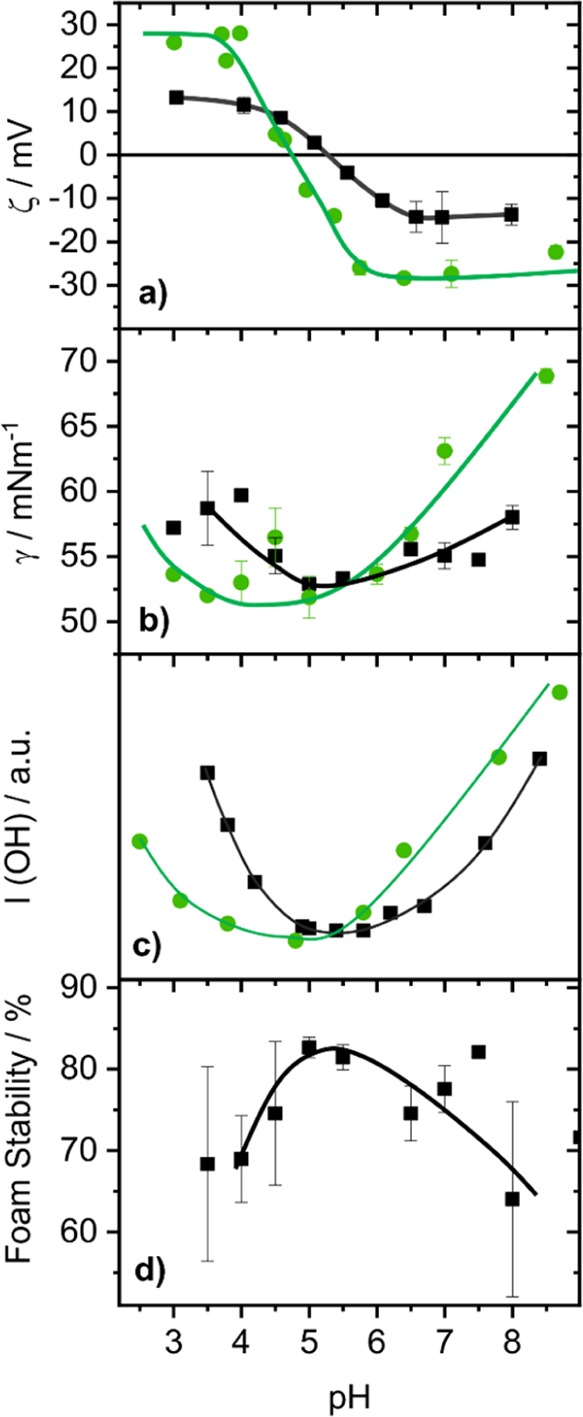
Effects of the bulk pH (rounded to 0.5 steps) for 50 μM BSA solutions on (a) the ζ-potential, (b) the surface tension γ after 30 min equilibration time, and (c) the averaged SFG intensity from the O–H stretching bands between 3150 and 3650 cm–1 (SFG spectra are shown in Figure 2). (d) Presents the foam stability (here defined as loss in foam height) after 30 min aging time in percent of the maximal foam height directly after foam formation (0 min). The results for native BSA are represented in black squares, whereas those for FITC-labeled BSA are represented by filled green circles. Solid lines guide the eye.
