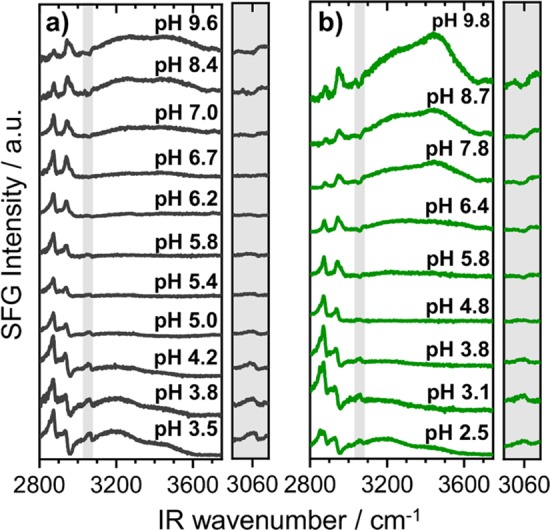
Figure 2.

pH dependent changes of SFG spectra from air–water interfaces that were modified by native (a) and FITC-labeled (b) BSA proteins. The frequency region that is presented in the figure is dominated by C–H and O–H stretching vibrations as explained in detail in the main text. The protein concentration in (a) and (b) was fixed to 50 μM. Gray-shaded areas show a close-up of the aromatic C–H stretching band at 3060 cm–1. Note that the shape of this band can be used to determine the net orientation of interfacial H2O (see main text).
