Table 6.
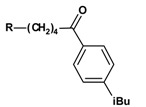
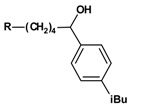
Inhibition of protein interaction in AN assay by compounds 9a-13a compared to compounds 2o and 3o (concentration: 50 µM, standard deviation ≤ 6 %).

|

|
|||
| R | compound | inhibition (%) | compound | inhibition (%) |
| azacyclonol | 2o | 60 | 3o | 67 |
Inhibition of protein interaction in AN assay by compounds 9a-13a compared to compounds 2o and 3o (concentration: 50 µM, standard deviation ≤ 6 %).

|

|
|||
| R | compound | inhibition (%) | compound | inhibition (%) |
| azacyclonol | 2o | 60 | 3o | 67 |