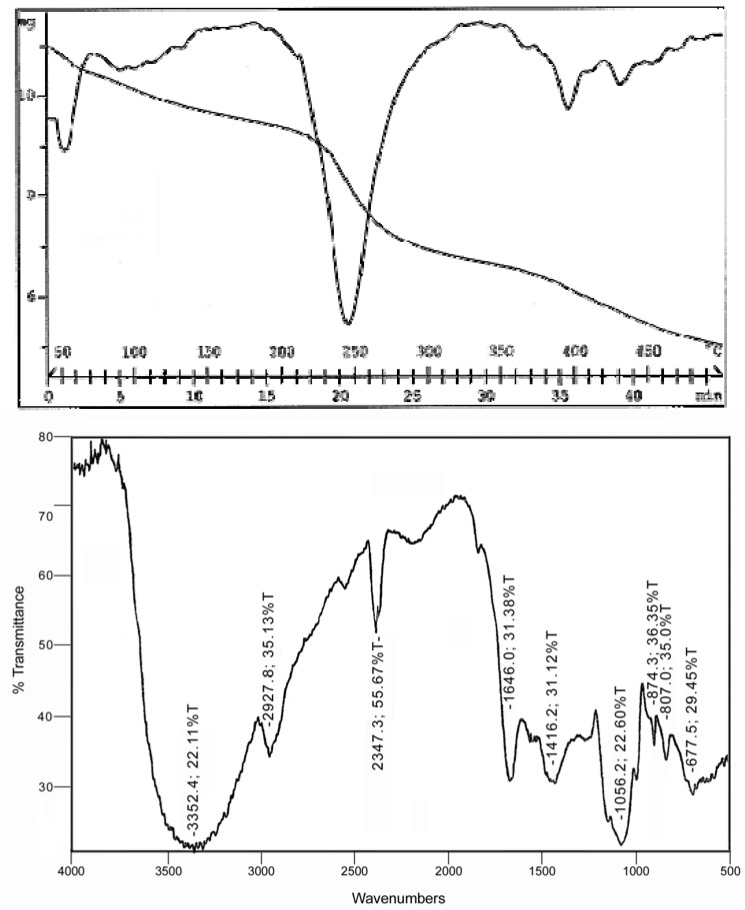
Figure 4.
Thermogravimetric analysis (top) and Fourier Transform Infrared spectrum (bottom) of Sample A.
Top: Thermogravimetric analysis of waste tomato sample A was performed using Mettler Toledo Star System equipped with a thermo analytical balance over a temperature range of 50° to 450°C with a temperature program of 10 min at 50°C followed by a 10°C/min ramp. Bottom: Fourier Transform Infrared spectrum of sample A recorded using a Perkin-Elmer Paragon 500 single-beam spectrophotometer. The powdered sample was ground with KBr, placed under the beam as a disk and the spectrum was collected after 16 scans under nitrogen.

