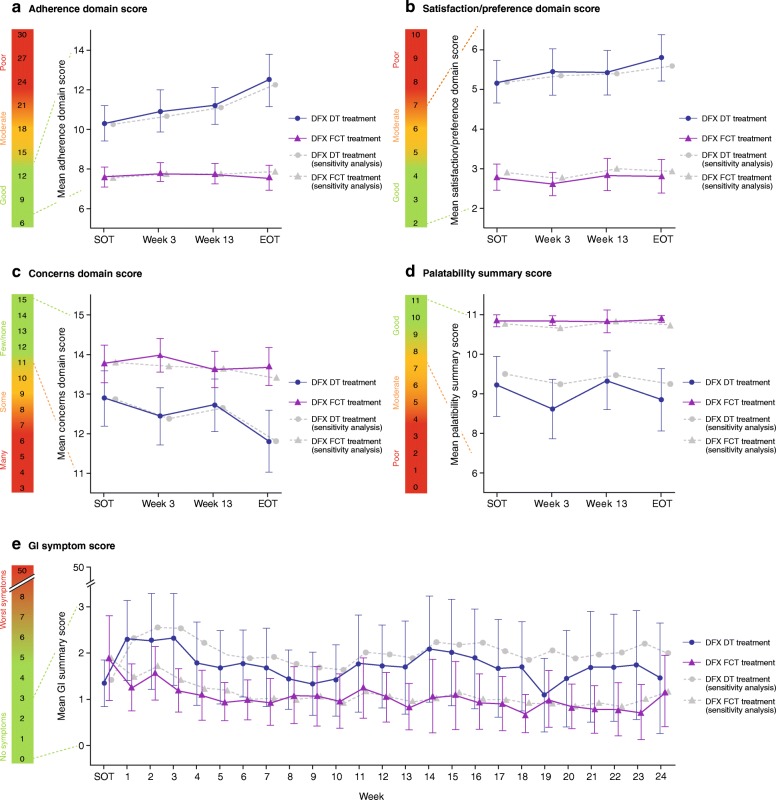
Fig. 1.
Mean ± 95% CI domain scores for patient-reported outcomes (adherence, satisfaction/preference, and concern) (a–c), mean palatability score (d), and mean gastrointestinal symptom scores (e). For adherence (a; scale 6–30), satisfaction/preference (c; scale 2–10), and GI symptoms (e; scale 0–50), higher scores indicate worse outcomes/symptoms. For concern (c; scale 3–15) and palatability (d; scale 0–11), higher scores indicate fewer concerns and better palatability. a–d, SOT was defined as week 2 assessment. If missing, then the week 3 assessment was considered SOT. e, SOT was defined as week 1 score. If missing, then the week 2 score was considered SOT. CI, confidence interval; DFX, deferasirox; DT, dispersible tablet; EOT, end of treatment; FCT, film-coated tablet; SOT, start of treatment. Figure adapted from Taher AT et al. Am J Hematology 2017;92(5):420–428. Published with kind permission of John Wiley & Sons ©2017 The Authors, American Journal of Hematology, Published by Wiley Periodicals, Inc.

