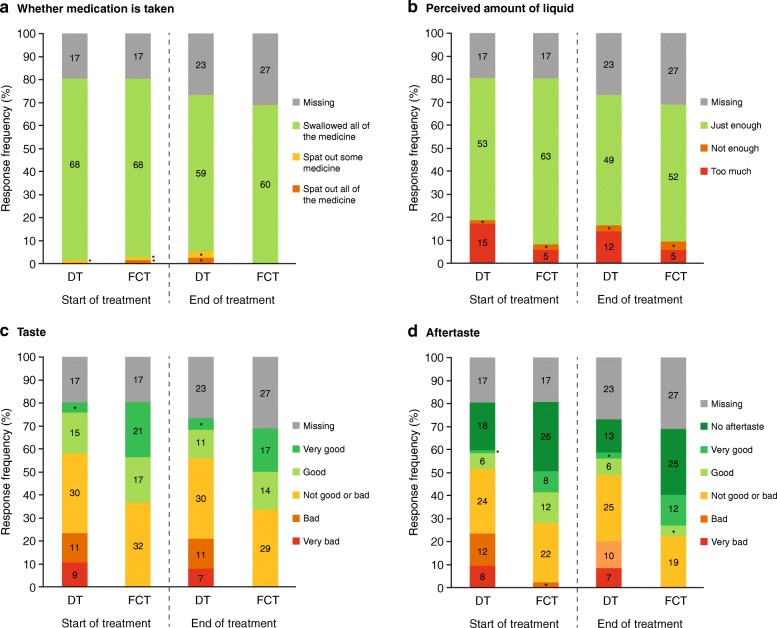
Fig. 4.
Response frequencies at week 2 (start of treatment) and end of treatment by treatment arm from the Palatability Questionnaire items, a Whether medication was taken, b Perceived amount of liquid, c Taste, and d Aftertaste. Numbers indicate the number of patients in each response category; *n < 5 patients; DT, dispersible tablet; FCT, film-coated tablet

