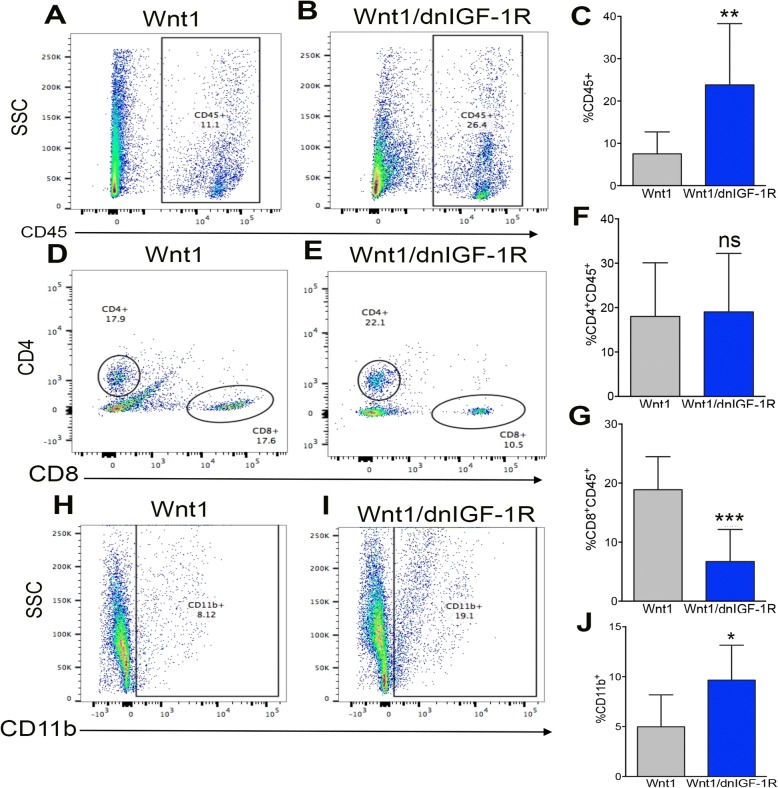
Fig. 4.
MMTV-Wnt1/dnIGF-1R tumors have altered immune cell infiltration. a, b Representative dot plot derived from flow cytometry measuring leukocyte marker CD45-PE/Cy5 of purified immune cells from Wnt1 (a) and Wnt1/dnIGF-1R (b) tumors. c Quantification of flow cytometry of CD45+ leukocytes in Wnt1 versus Wnt1/dnIGF-1R tumors (Wnt1/dnIGF-1R versus Wnt1 **P < 0.01; n = 20 each group). d, e representative dot plot of flow cytometry using cell surface markers to select for helper/regulatory T cells (CD4+CD45+) or cytotoxic T cells (CD8+CD45+) in Wnt1 (d) or Wnt1/dnIGF-1R (e) tumors. f, g Quantification of flow cytometry of CD4+CD45+-stained T cells (f) or CD8+CD45+-stained cytotoxic T cells (g) in Wnt1 versus Wnt1/dnIGF-1R tumors (CD4+CD45+ Wnt1/dnIGF-1R cells versus Wnt1 cells P > 0.05 (ns, not significant); CD8+CD45+ Wnt1/dnIGF-1R cells versus Wnt1 cells ***P < 0.001; n = 20 each group). h, i representative dot plot of flow cytometry using monocyte marker CD11b-PerCP of purified immune cells from Wnt1 (h) and Wnt1/dnIGF-1R (i) tumors. j Quantification of flow cytometry of CD11b+ monocytes in Wnt1 versus Wnt1/dnIGF-1R tumors (Wnt1/dnIGF-1R versus Wnt1 *P < 0.05; n = 20 each group)

