Fig. 6.
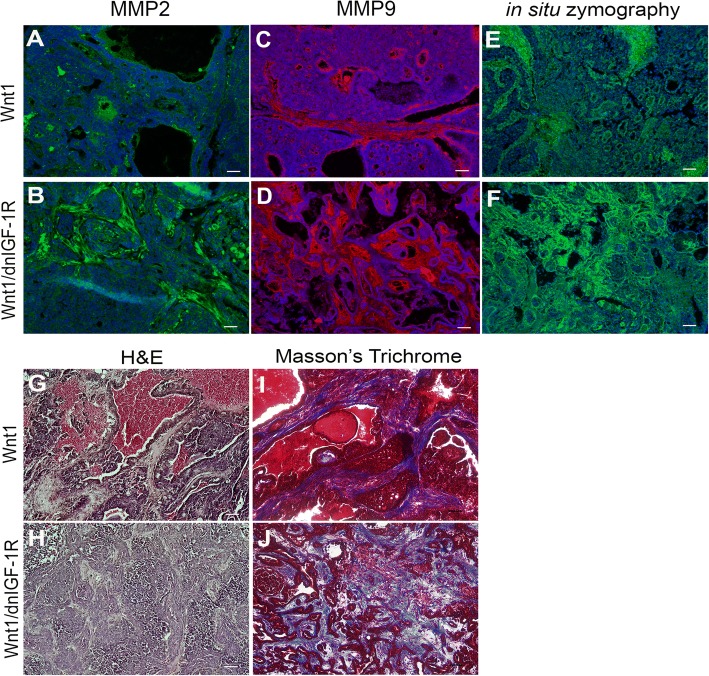
Increased aggressive tumor microenvironment in MMTV-Wnt1/dnIGF-1R compared to MMTV-Wnt1 tumors. a-d Representative photomicrographs showing immunofluorescence staining of matrix metalloproteinase (MMP)2 (green) and MMP9 (red) in Wnt1 (a, c) and Wnt1/dnIGF-1R (b, d) tumor sections. e, f Representative photomicrographs depicting active MMPs through in situ zymography (green) in Wnt1 (e) and Wnt1/dnIGF-1R (f). g, h Representative H&E-stained tissue sections from MMTV-Wnt1 (Wnt1) (g) and MMTV-Wnt1/dnIGF-1R (Wnt1/dnIGF-1R) (h) tumors. i, j Representative Masson’s Trichrome-stained tissue sections for collagen (blue) in Wnt1 (i) and Wnt1/dnIGF-1R (j). Sections (a-f) were stained with 4',6-diamidino-2-phenylindole to detect nuclei (blue). Scale bar = 100 μm

