Figure 2.
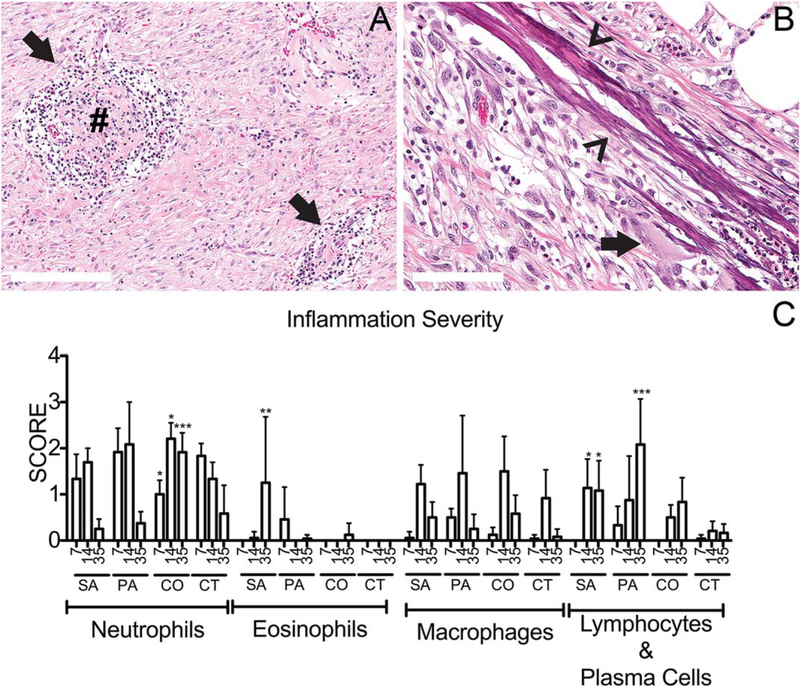
Scoring inflammation in the infected chronic wound. (A) P. aeruginosa infected wounds at 35 days postinfection (PI) contained organized lymphoplasmacytic nodules (arrows) within the dermal wound bed. Occasionally these nodules contained a central core of dense hylanized collagen (#). (B) S. aureus infected wounds contained collagen bundles with mineral deposition (arrowheads) with minimal amounts of associated inflammation (multinucleated giant cell, arrow) at day 14 PI. (C) Using the grading scheme outlined Table 1, the individual wound histology parameters were scored and averaged from six segments evenly distributed across the wound. Inflammatory parameters were scored 0–4 as outlined in Tables 1 and 2. For the graph above, C: x-axis represents time points day 7, 14, and 35 postinfection; SA, S. aureus, PA, P. aeruginosa, CO, coinfected wounds, and CT, control wounds. The mean scores are graphed here with standard deviation error bars and statistical significance measured by 2-way ANOVA, p < 0.05 [Color figure can be viewed at wileyonlinelibrary.com]

