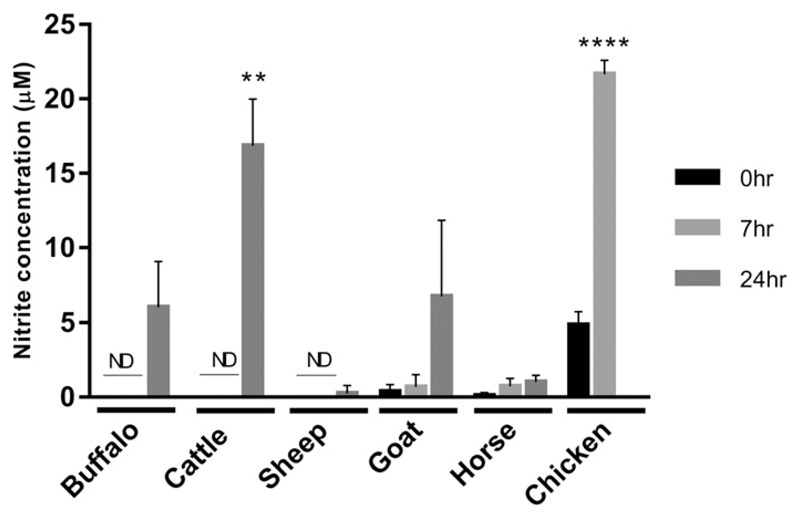
Figure 1. LPS-inducible NO production in macrophages.
Supernatants were collected from LPS stimulated (S. enterica; 100 ng/ml) BMDM from water buffalo, cattle, sheep, goat, and horse at 0, 7, and 24 h poststimulation and nitrite production measured by Griess assay. Stimulated chicken BMDM 0 and 7 h poststimulation were used as a positive control. Mean nitrite levels are shown with error bars for the SD of the mean for three biological replicates per species, performed in duplicate. Statistically significant differences versus unstimulated cells are indicated (t test; ****p < 0.0001, **p < 0.01). ND, not detected.

