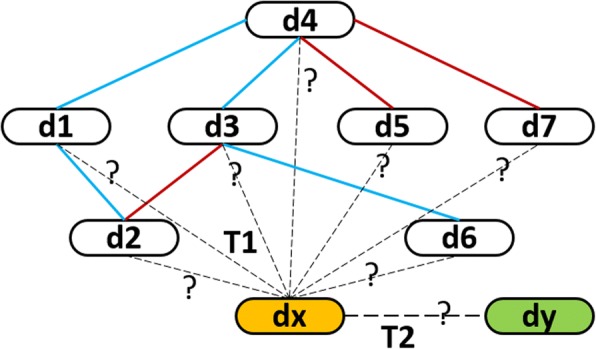
Fig. 1.

Illustration of predicting tasks. Drugs in DDI network are represented as capsule-like nodes. Known drugs are numbered from d1 to d7 and their interactions are denoted by the solid lines. Enhancive interactions and degressive interactions are highlighted by red lines and blue lines respectively. Two newly given drugs are the isolated nodes, which are labeled by dx and dy, and are filled by yellow and green respectively. Two types of predicting tasks, tagged by ‘T1’ and ‘T2’, are indicated by dotted lines. T1 predicts how likely dx interacts with those known drugs, while T2 predicts how likely dx interacts with dy. Both of them predict whether these potential interactions increase or decrease the pharmacological behaviors of these interacting drugs
