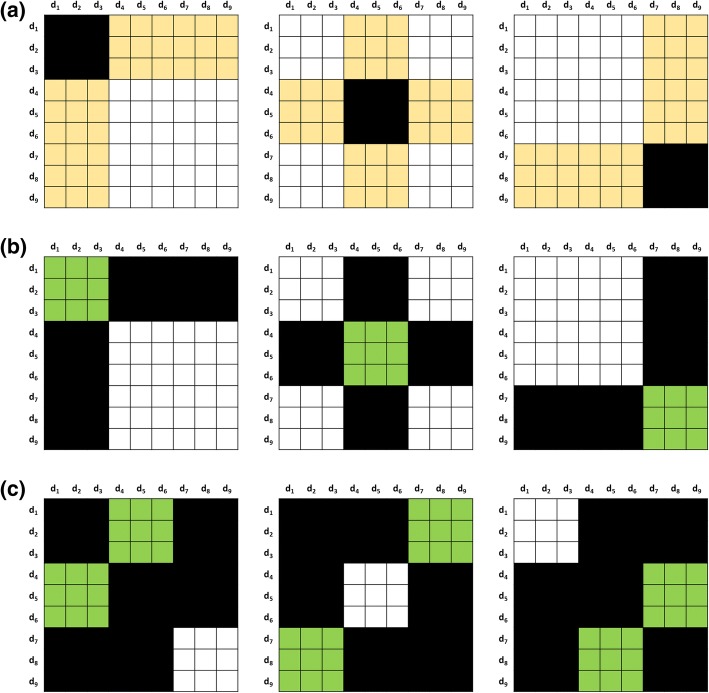
Fig. 3.
Illustration of K-CV schemes. The 9 × 9 DDI adjacent matrix is represented by a table with 9 × 9 cells. It is split into different blocks, which account for training, testing and discard parts, and are filled with different colors accordingly. All the entries in the white block are used to train the TMFUF, the entries in the yellow and the green block denote the testing entries in T1 and T2 respectively, and the entries in the black region are blind to the training and testing. Three subfigures show different 3-CV schemes: a the sampling in CV1, b the within-group sampling in CV2, and c the between-group sampling in CV2

