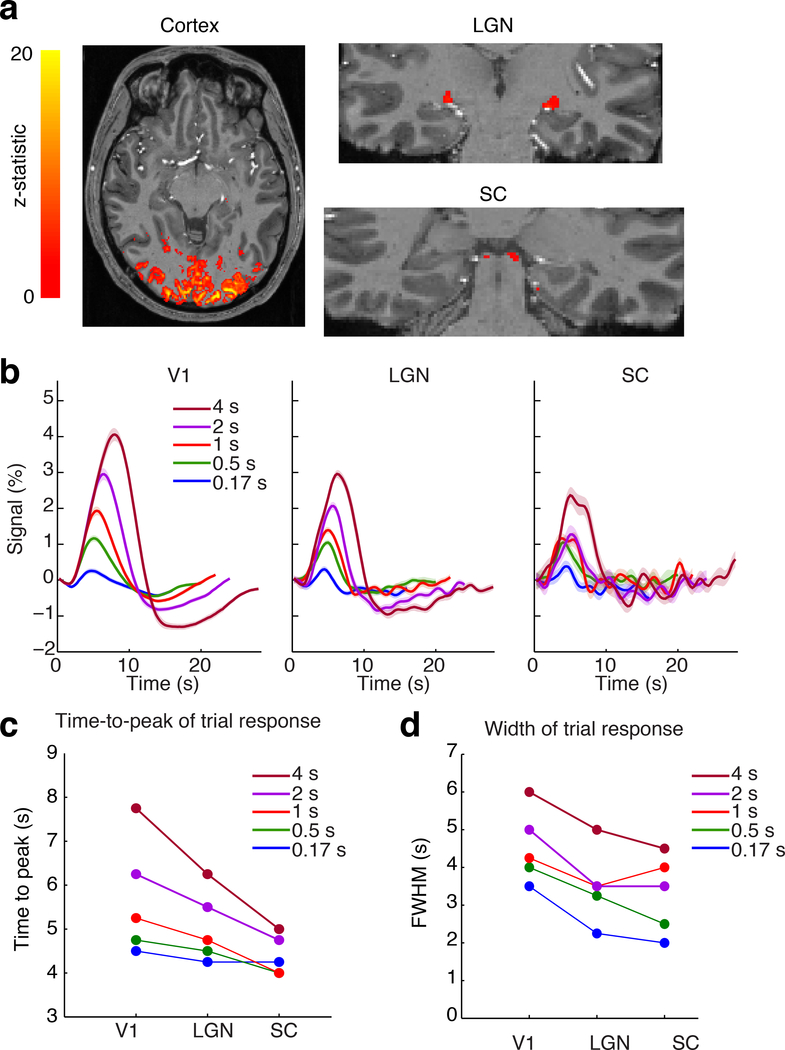
Figure 1: Visual-evoked activity in cortex, thalamus, and brainstem.
A) Activation map from a representative subject in the localizer runs (16 s block stimulus) shows activity across visual cortex, LGN, and SC. B) Mean trial responses to stimuli of varying durations in each ROI. Shaded regions reflect standard error across subjects (n=23). C) Peak time of the trial response in each region for each stimulus duration, shows consistently increased response speed in subcortical structures. D) Full-width-half-maximum of the trial response shows narrower responses in subcortical structures, across stimulus durations.

