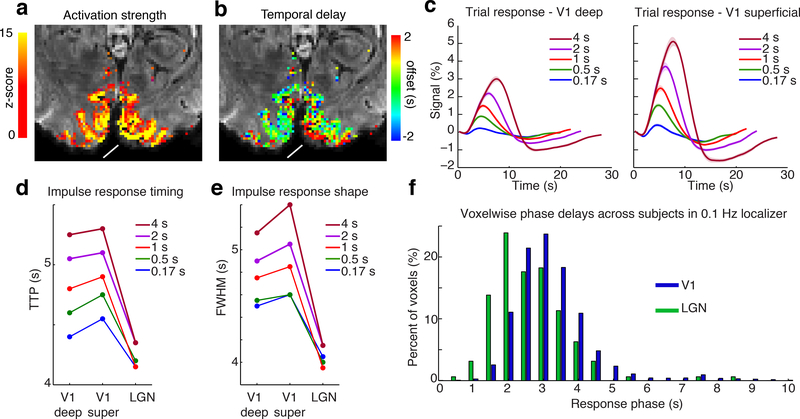
Figure 5: Distribution of temporal properties within cortex and LGN.
A) Example activation map within visual cortex in the localizer run (16 s block) in one subject shows stronger activation towards the pial surface. White arrow highlights a region of the surface with large and slow responses. B) Example temporal delay map within the same subject shows spatially structured delays, with larger delays towards the pial surface. C) Mean trial response in a V1 ROI defined to include deep (gray-white boundary) voxels and superficial (pial surface) voxels shows consistently larger and later responses in the deep ROI (n=23 subjects, shaded region is standard error). D and E) Time to peak (TTP) and full-width-half-maximum (FWHM) of the impulse response across deep and superficial V1 and LGN shows a gradient of peak timing (n=14 subjects). F) Distribution of temporal lags across structures in the 0.1 Hz oscillatory stimulus experiment shows heterogeneous properties across structures (n=5 subjects).

