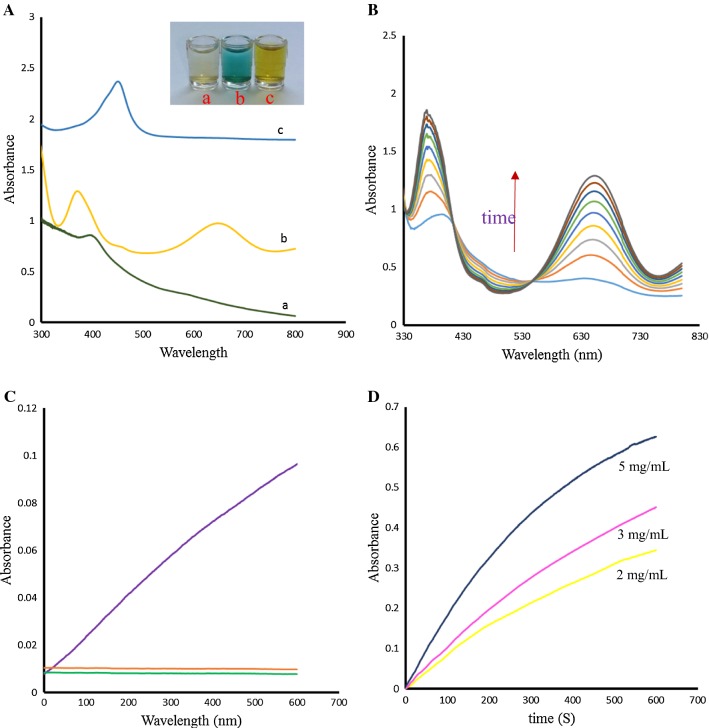
Fig. 5.
A UV–vis and photographs of (a) Ni-hemin MOF solution (b) Ni-hemin MOF +TMB + H2O2 (c) Ni-hemin MOF +TMB + H2O2 +H2SO4, B Time-dependent UV–vis spectral changes of TMB solution with H2O2 catalyzed by NiO MOF, C Time-dependent absorbance changes of (a) Ni-hemin MOF solution (b) TMB + H2O2 (c) Ni-hemin MOF +TMB + H2O2 at 652 nm, and D Time-dependent absorbance changes of TMB solution with H2O2 at 652 nm in the presence of different concentrations of NiO MOF

