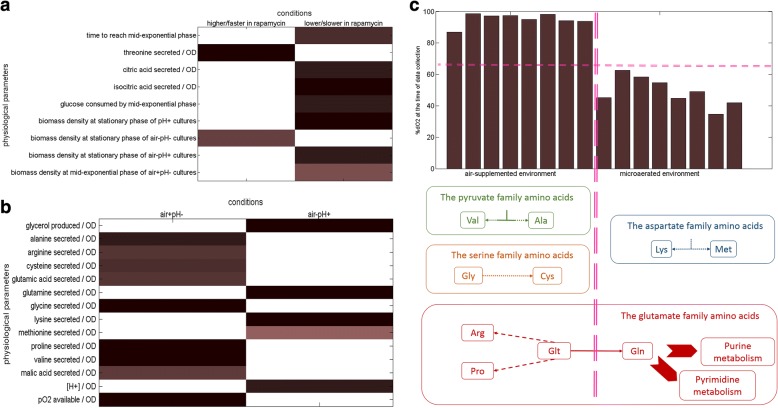
Fig. 2.
Overall analysis of the physiological response of yeast to long-term exposure to rapamycin. Physiological parameters that showed a significant difference in response to rapamycin are displayed in (a). The two columns in the plot separate those responses that were higher (or faster depending on the parameter) in yeast cultures that were exposed to rapamycin, from those that were lower (or slower). Metabolite yields that showed a significant difference in air+pH- and air-pH+ cultures are displayed in (b). The two columns in the plot separate those responses that were higher yields achieved in either air+pH- or air-pH+ cultures. Colour white denotes non-significant measurement in both plots (a) and (b), and deeper the shade (towards mahogany), higher the significance of the evaluation (i.e. lower the p-value of the test statistic). Summary of the findings in (b) within the context of fermenter dO2 levels is displayed in (c). The amino acids whose yields changed significantly between air+pH- and air-pH+ cultures are structured into families based on their ancestor molecule (colour-coded similarly), and these responses are coupled with a plot displaying the dO2 availability of these cultures at the time of sampling (top display). The horizontal magenta dashed line accentuates the difference in oxygen availability at the time of sampling, and the vertical magenta dashed line separates responses for air+ and air- cultures

