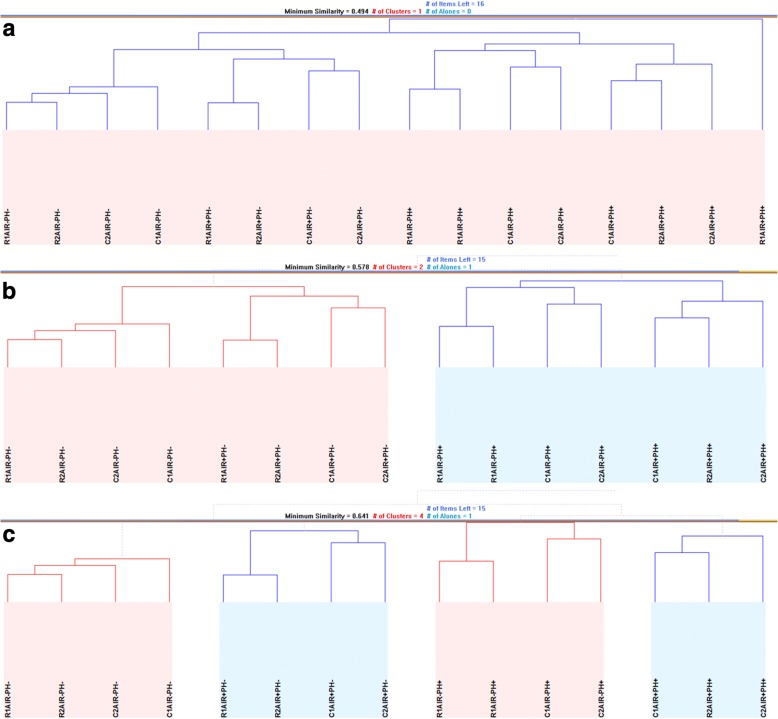
Fig. 4.
Hierarchical similarity of the global gene expression profiles among the cultures. The hierarchical clustering of the transcriptome data for representing all 16 cultivations within a single cluster are shown at a minimum Pearson similarity distance of 0.494 (a). Two clusters denoted by pale blue and pale pink shaded areas are formed by employing a tighter metric than in (a) with a minimum Pearson similarity distance of 0.578. This measure leaves R1AIR + PH+ as a loner and the two clusters indicate differences in pH control among the cultures (b). Four clusters are formed of the remaining 15 cultures at an even tighter metric than that employed in (b) with a minimum Pearson similarity distance of 0.641, and these clusters are denoted by alternating pale blue and pale pink shaded areas. These clusters distinguish between the control of dissolved oxygen availability as well as pH (c). In all sub-figures, “C” denotes the control cultures and “R” denotes the rapamycin-treated cultures; “1” and “2” identify the replicates of the same experimental setup

