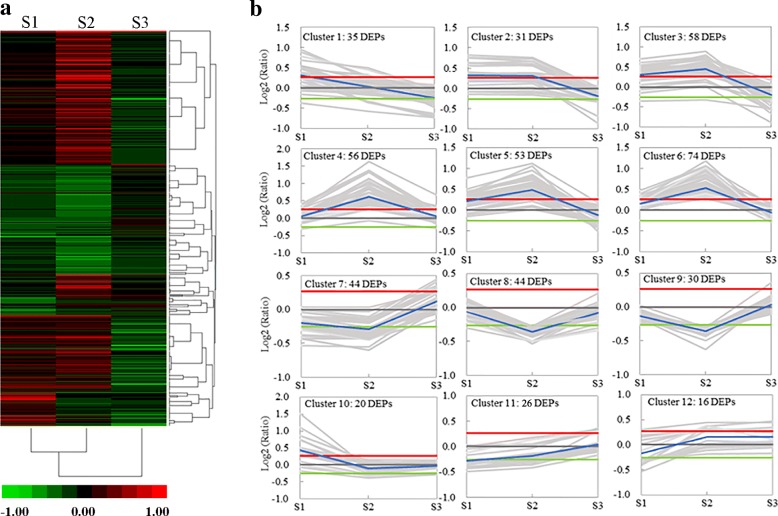
Fig. 5.
Expression profiles of DEPs in three development stages of anther between ‘Wuzi Ougan’ and ‘Ougan’. a Heat map for cluster analysis of the differentially expressed proteins by K-means method. Color indicates the fold change (red indicates up-regulated; green indicates down-regulated). b Mev cluster analysis of differentially expressed proteins from the protein expression profiles. The blue line is the mean of Log2(ratio) in each cluster, the red and green lines indicate cut-off of up or down protein regulated, respectively. Ratio indicated the ratio of average abundance between MT and WT at each stage. S1, S2, S3 are three developmental stages during microsporogenesis according to the length of floral bud: S1 (Stage 1) indicates the stage when the microsporogenesis initiated from sporogonium with bud length of 1.2 mm–1.6 mm, S2 (Stage 2) represents the stage when the microsporogenesis developed into the early microsporocyte with bud length of 2.0 mm–2.4 mm, and S3 (Stage 3) refers to the stage when the microsporogenesis entered into meiosis with bud length of 2.4 mm–2.8 mm

